Easing Into Slowing Growth
- The question investors need to ask is whether the pivot, or expectation of pivot, to accommodative monetary policy across several major economies can compensate for slowing growth.
- To help explain the dichotomy of well-performing risk assets – even considering recent market volatility – in a softening growth environment, we discuss our tactical model for asset allocation that complements our macroeconomic analysis. We also delve into our approach to equity market analysis.
- In our multi-asset allocation portfolios, we remain defensively positioned with a mild risk-off stance and look to maintain healthy liquidity buffers. We maintain a focus on high quality and defensive sectors across stock and bond markets, preferring the U.S. over other developed markets.
- In light of our expectations of continued dovish central bank policy, we are overweight real assets as well as select emerging markets bonds and currencies. Thoughtful analysis is critical as always in light of differentiation across regions and sectors.
The divergence between the strength of global risk asset markets against a backdrop of weakening global growth in 2019 has confounded many investors. Asset valuations have climbed to fresh highs since the start of the year, with equities, credit spreads, and rates all performing well overall, despite bouts of market volatility this summer, a decline in corporate profitability, and slumping global investment demand. While slowing economic and profit growth is not usually a recipe for risk asset strength, the slowdown has prompted a swift reversal in global central bank policy, which has boosted asset prices via both lower discount rates as well as expectations of new rounds of quantitative easing. Market expectations for future policy rate hikes across the major G-3 economies have turned into expectations for cuts, and actual cuts in many cases. Real interest rates, or the measure of rates adjusted for inflation, have collapsed.
It is important to note that while aggregate measures of cross-asset returns have shown little reflexivity to the global growth backdrop, under the surface there has been significant differentiation across factors, regions, and sectors, which is masked by some of the broader market ebullience. The macro divergence across the service and manufacturing sectors has played out across equities, with defensive equities outperforming cyclical stocks and quality outperforming value,1 which has aligned with PIMCO’s view at the start of 2019 advocating for high quality and defensive portfolio positioning (see our full-year outlook, “Late Cycle vs. End Cycle Investing”).
With easing now well priced into markets and future growth continuing to appear uncertain, the question investors need to ask is whether accommodative policy can compensate for a slowing, but still growing economy. PIMCO’s base case for the global economy over the next three to five years is for a continuation of lackluster economic growth on average, with low inflation persisting and central banks keeping interest rates at or below New Neutral levels (markets are currently pricing rates well below these). However, there are at least five secular trends with the potential to disrupt the global economy (those factors are detailed in PIMCO’s Secular Outlook, “Dealing With Disruption”).
In the following sections, we share our views across asset classes. We also do a deep dive into two specialized topics: our tactical model for asset allocation that complements our macroeconomic analysis, and our approach to equity investing, which combines balance sheet analysis with insights from style factors and the profit cycle. We hope these two deep dives help explain the ramifications of the dichotomy of well-performing risk assets in a softening growth environment.
While there is a lot of movement beneath the hood (amid specific sectors and market drivers), our high-level view for multi-asset allocation portfolios is little changed from earlier in the year: We are defensively positioned with a modest overweight to high quality duration and an underweight to risk assets. Respecting the state of the business cycle, we maintain a focus on high quality and defensive sectors across stock and bond markets, preferring the U.S. over other developed markets. In light of our expectations of continued dovish central bank policy, we are overweight real assets as well as select emerging markets bonds and currencies. We look to maintain healthy liquidity buffers given our long-term view of stress on financial market structure as evidenced by lower liquidity and increased frequency of “flash crashes.”
Macro modeling asset allocation
To help extract a signal from the noisy and conflicting information from business cycle and financial condition indicators, we employ a robust, systematic framework for tactical asset allocation that complements the discretionary approach based on the macroeconomic analysis PIMCO is known for.
Broadly, our models for asset allocation begin with a set of strategic views anchored in valuations, adjusting for quality and carry. However, asset prices could potentially veer from fundamentals for sustained periods of time, and lead to slow mean-reversion of valuations. We therefore bolster our strategic asset allocation decisions with a set of tactical tilts that rely on systematic variations in asset risk premia over the business cycle.
This systematic framework for tactical asset allocation is based on the empirical observation that macroeconomic conditions tend to evolve in a slow, measured manner. Asset markets, however, tend to underreact in the near term to this persistence in macroeconomic fundamentals (notwithstanding the frantic short-term trading that accompanies significant data releases). As a result, we’ve often found it beneficial to determine tactical asset allocation tilts based on the current state of the macro economy, in anticipation of markets fully pricing in macroeconomic trends.
In order to successfully do this, investors need to take a nuanced approach to teasing out the current state of the economy by identifying an appropriate set of indicators for the health of the global economic cycle. As such, this approach is ideally suited to PIMCO’s investment process, which has relied on analyzing a broad gamut of macroeconomic indicators over the past four decades.
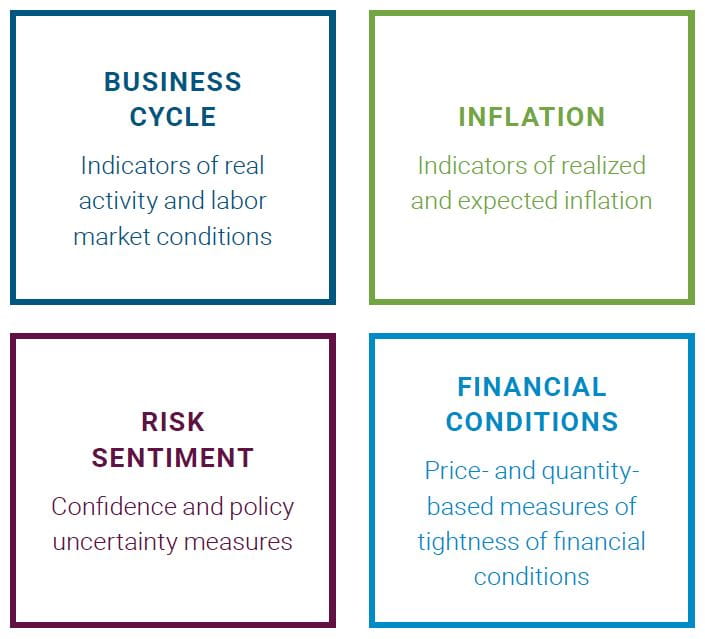
Within each category, we include a curated set of variables that together offer a comprehensive view of current macroeconomic conditions across regions. Secondly, we incorporate a systematic view of the impact of shocks to each of these variables on various markets. For example, a positive shock to employment conditions tends to positively affect risk-on factors (like equities or credit spreads), but negatively affect risk-off factors like high quality duration. We believe such an approach provides a robust tactical complement to a value-oriented strategic asset allocation.
How has PIMCO’s tactical model evolved in the recent past?
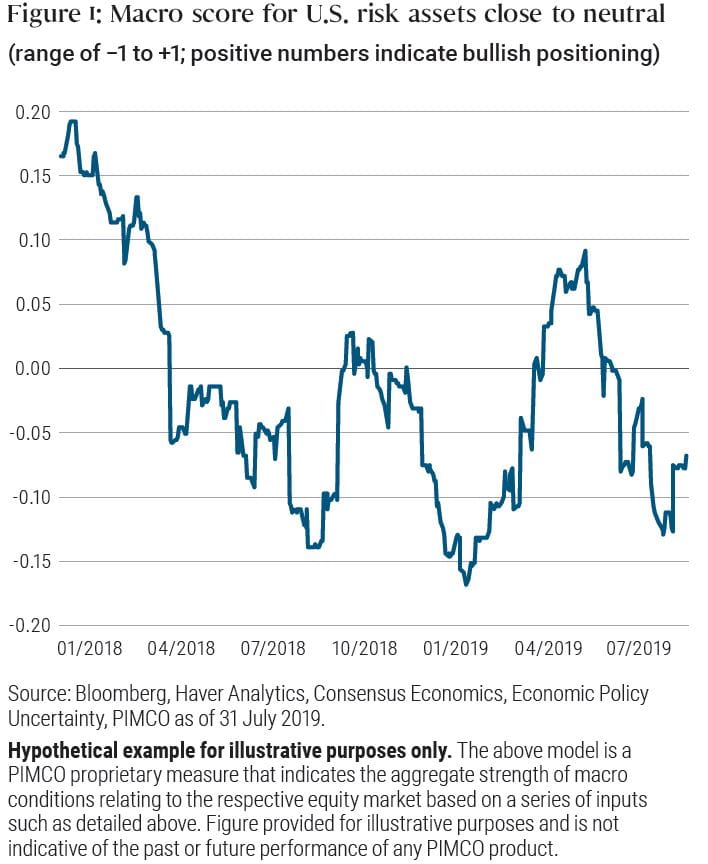
Through the last quarter of 2018, macro scores for global equities and credit in our tactical asset allocation model deteriorated steadily, driven mainly by a weakening of business cycle conditions. Macro scores then strengthened in early 2019 before becoming more uneven recently (for example, see our model scores for U.S. risk assets in Figure 1).
We also combine our four macro categories into a four-pointed cluster (or “spider web”) graphic that visually charts changes over time – see Figure 2. Since the end of 2018, macro conditions have improved despite deteriorating business cycle conditions of weakening real activity and labor market indicators. These have been offset by softening inflation prints, which support the case for policy easing, as well as indicators of stronger sentiment and looser financial conditions.
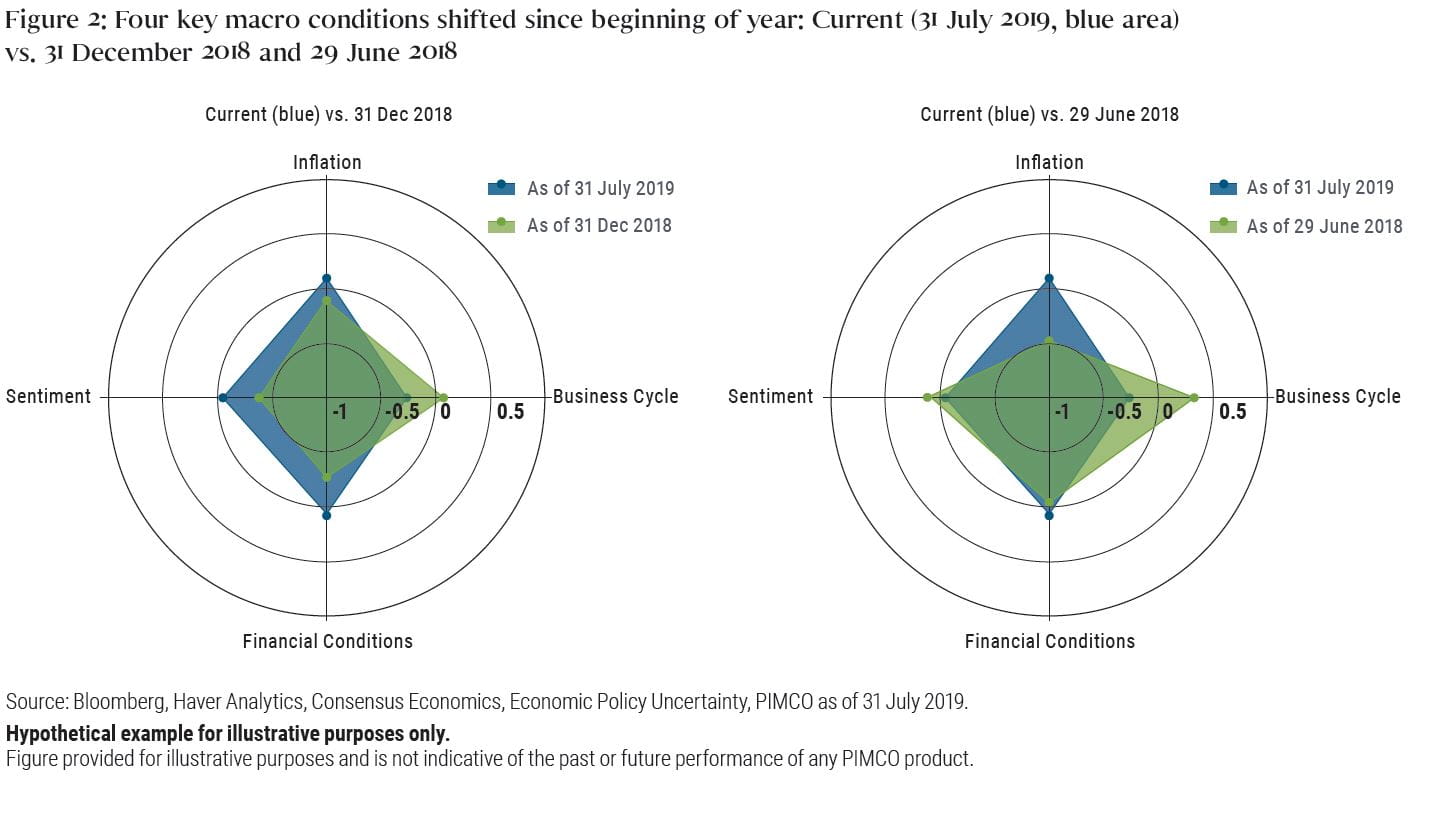
On net, combining the information from our four-point cluster of indicators, our tactical asset allocation model is modestly overweight duration and underweight equities and credit spreads in developed markets. On the currency side, the model suggests an underweight position in the U.S. dollar.
We detail our current positioning, which is a combination of the systematic model output as well as discretionary positioning based on macroeconomic and relative value analysis, in our Asset Class Views.
Equity market analysis: pinpointing quality, monitoring signals
For much of the last year we have advocated a defensive, high quality equity portfolio. Our defensive position was a direct output of our empirical analysis of what works in a “growing but slowing” environment and a forecast that the profit growth cycle would slow in 2019. Our analysis currently continues to support a defensive stance, but as in other asset classes, nuances are critical: Subtle signals help us pinpoint alpha opportunities, and assess the likelihood and timing of market shifts that would trigger a change in our investment view.
In this section, we analyze equity markets using three perspectives that help guide our positioning.
Profit signals
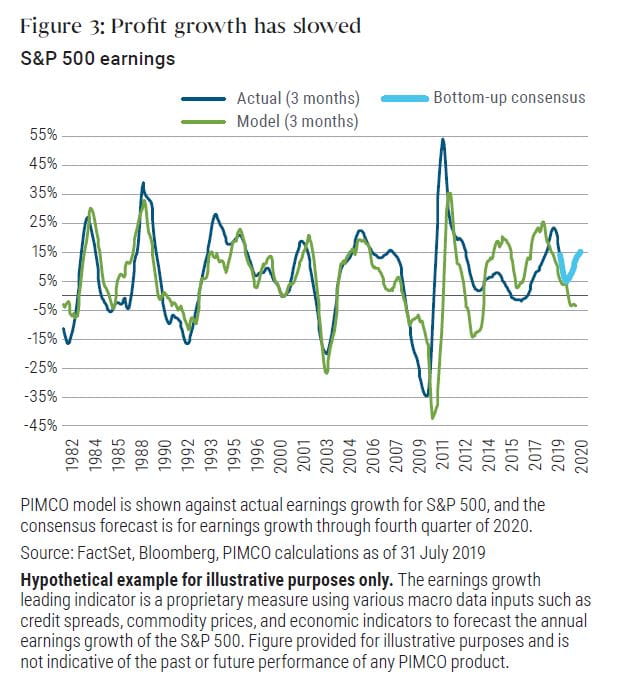
Looking at U.S. equities, profit growth has slowed in line with our model forecast (see Figure 3), which currently suggests the weak growth backdrop persists into early next year.
Empirically, our work shows the profit growth cycle is an important input for determining equity portfolio positioning and identifying winners from losers. When profit growth is high (>= +5%) and rising, investors don’t need to pay for it, resulting in a preference for cyclical value (“cheap” stocks). But when growth is slowing, investor preference tends to shift toward growth certainty with increased focus on profitability, and many investors are willing to pay a premium for companies with such characteristics.
When we segment S&P 500 trailing earnings growth into four distinct phases (slowdown, contraction, recovery, and expansion) and evaluate empirical returns, we observe distinct and consistent patterns through time. In a slowing earnings growth environment, while absolute equity market returns are often positive, the strength of returns often deteriorates, becoming lower and more volatile. Historically, we observe a consistent pattern of defensive equity market flows during periods of slowing growth as investors seek to insulate their portfolios from high beta, cyclically exposed market sectors.
Style mapping
By studying historical returns across equity styles, we seek to identify the sectors and styles with the greatest empirical odds of performing well in a given area of the profit cycle (see previous point). During periods when profit growth rates are decelerating, we typically see negative risk-adjusted returns for cyclical groups relative to defensive groups. Furthermore, companies with high quality characteristics (e.g., high profitability) and exposure to the momentum factor typically perform best during periods when profit growth rates are decelerating. Empirically, the value, size, and cyclical factor groups typically don’t generate attractive volatility-adjusted returns until profit growth rates are rising.
Of course, this doesn’t mean there won’t be select opportunities along the way nor does it guarantee the past will perfectly reflect the future, but such analysis helps serve as a roadmap for equity portfolio construction.
Know your country
Analyzing favorable market styles and sectors is important in determining one’s geographic equity allocation. The sectoral composition and quality of institutions can vary meaningfully by region.
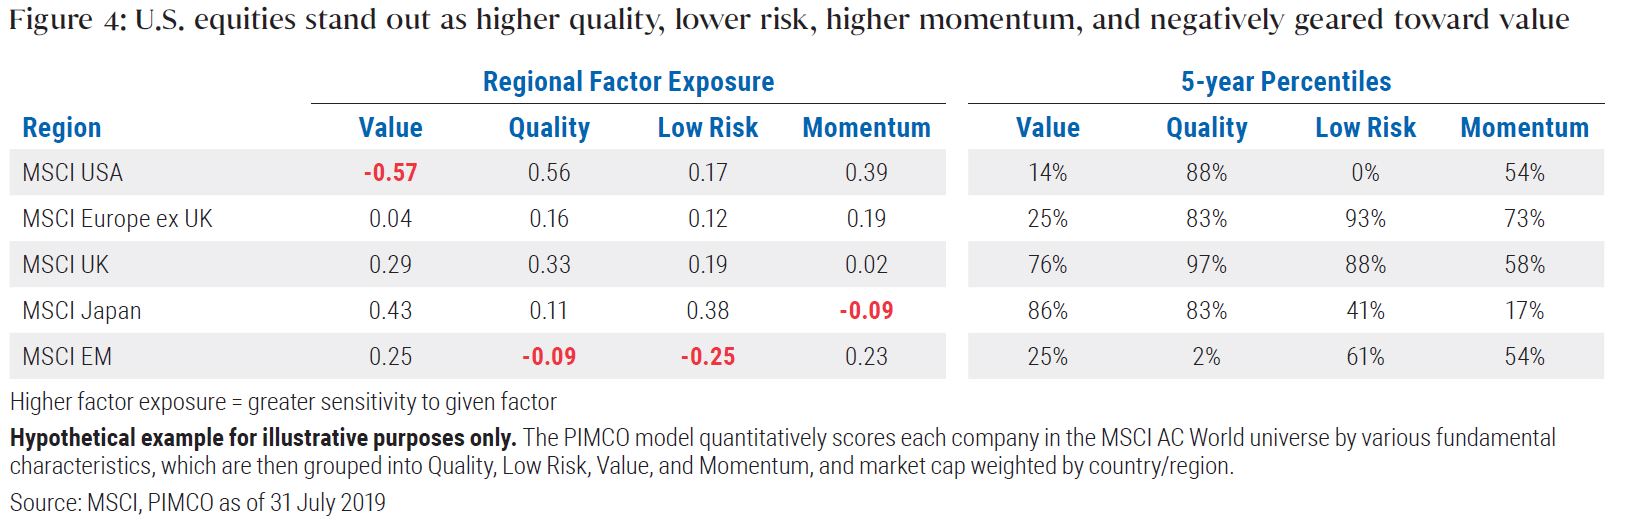
For example, when evaluating major equity market regions according to PIMCO’s equity quantitative scoring methodology (see Figure 4), we see that U.S. equities stand out as higher quality, lower risk, higher momentum, and negatively geared toward value. Taking into account what works during slower growth environments (see previous points), it is easier to understand current U.S. equity market outperformance.
When the global economy suffers a manufacturing- and trade-oriented slowdown, non-U.S. equity markets – which generally carry greater cyclical exposure – tend to be more exposed.
Many investors tend to believe U.S. markets are expensive when compared with Europe, Japan, or emerging markets. However, it is important to consider profitability, growth, and volatility differences among regions when making the valuation call. It is true U.S. markets usually trade at slightly higher-than-average absolute valuation levels, based on forward price-to-earnings ratios. However, return on equity (ROE) is also above average and 30%–50% higher relative to other regions in the world, while U.S. earnings growth rates are comparable – and at lower volatility.
Of course as growth momentum bottoms and profit growth becomes more abundant, it will likely call for a shift in equity portfolio composition that takes on increased exposure to cyclicals, value, and non-U.S. exposure. Volatility may become a fixture in equity markets. We think it is early to make a hard rotation to a higher-beta equity portfolio, but remain increasingly focused for a potential turn in growth momentum before we take an aggressive long stance in equities.
Key takeaways
We are in a late cycle environment in which macro conditions are increasingly signaling deterioration, and this fact alone calls for nuanced portfolio construction. However, our macro models suggest that the economic softening so far has been largely offset by central banks around the world pivoting to easing, which has loosened financial conditions considerably. As such, our portfolio positioning remains relatively stable compared with earlier in the year, with a mild risk-off stance.
While we suggest investors consider remaining invested, we highlight important distinctions, and clearly a lot more attention needs to be paid to attributes of each asset in the portfolio. Given the absence of macroeconomic recovery signs so far, we believe quality should be boosted in portfolios even if the factor has outperformed so far this year. We believe the temptation to go down the quality ladder should still be resisted!
Looking forward, it still remains unclear if the loosening of financial conditions will manage to turn the outlook around, and as such we favor portfolios remain liquid. If the macroeconomic momentum were to improve again, emphasis is likely to be via rotations toward more cyclical equities in the portfolio as opposed to large beta changes. In contrast, if macroeconomic momentum continues slowing, we would prepare portfolios for a shallow yet probably long recession.
The authors thank Mukundan Devarajan and Bill Smith for their significant contributions to the systematic asset allocation and equity market analysis, respectively.
Featured Participants
Disclosures
Past performance is not a guarantee or a reliable indicator of future results.
All investments contain risk and may lose value. Investing in the bond market is subject to risks, including market, interest rate, issuer, credit, inflation risk, and liquidity risk. The value of most bonds and bond strategies are impacted by changes in interest rates. Bonds and bond strategies with longer durations tend to be more sensitive and volatile than those with shorter durations; bond prices generally fall as interest rates rise, and low interest rate environments increase this risk. Reductions in bond counterparty capacity may contribute to decreased market liquidity and increased price volatility. Bond investments may be worth more or less than the original cost when redeemed. Sovereign securities are generally backed by the issuing government. Obligations of U.S. government agencies and authorities are supported by varying degrees, but are generally not backed by the full faith of the U.S. government. Portfolios that invest in such securities are not guaranteed and will fluctuate in value. Inflation-linked bonds (ILBs) issued by a government are fixed income securities whose principal value is periodically adjusted according to the rate of inflation; ILBs decline in value when real interest rates rise. Treasury Inflation-Protected Securities (TIPS) are ILBs issued by the U.S. government. Equities may decline in value due to both real and perceived general market, economic and industry conditions. Investing in foreign-denominated and/or -domiciled securities may involve heightened risk due to currency fluctuations, and economic and political risks, which may be enhanced in emerging markets. Currency rates may fluctuate significantly over short periods of time and may reduce the returns of a portfolio. Commodities contain heightened risk, including market, political, regulatory and natural conditions, and may not be suitable for all investors. Investing in MLPs involves risks that differ from equities, including limited control and limited rights to vote on matters affecting the partnership. MLPs are a partnership organised in the US and are subject to certain tax risks. Conflicts of interest may arise amongst common unit holders, subordinated unit holders and the general partner or managing member. MLPs may be affected by macro-economic and other factors affecting the stock market in general, expectations of interest rates, investor sentiment towards MLPs or the energy sector, changes in a particular issuer’s financial condition, or unfavorable or unanticipated poor performance of a particular issuer. MLP cash distributions are not guaranteed and depend on each partnership’s ability to generate adequate cash flow. Mortgage- and asset-backed securities may be sensitive to changes in interest rates, subject to early repayment risk, and while generally supported by a government, government-agency or private guarantor, there is no assurance that the guarantor will meet its obligations. High yield, lower-rated securities involve greater risk than higher-rated securities; portfolios that invest in them may be subject to greater levels of credit and liquidity risk than portfolios that do not. Income from municipal bonds is exempt from federal income tax and may be subject to state and local taxes and at times the alternative minimum tax. The credit quality of a particular security or group of securities does not ensure the stability or safety of the overall portfolio. Diversification does not ensure against loss.
Management risk is the risk that the investment techniques and risk analyses applied by the investment manager will not produce the desired results, and that certain policies or developments may affect the investment techniques available to the manager in connection with managing the strategy. There is no guarantee that these investment strategies will work under all market conditions or are suitable for all investors and each investor should evaluate their ability to invest long-term, especially during periods of downturn in the market. Investors should consult their investment professional prior to making an investment decision.
Hypothetical and simulated examples have many inherent limitations and are generally prepared with the benefit of hindsight. There are frequently sharp differences between simulated results and the actual results. There are numerous factors related to the markets in general or the implementation of any specific investment strategy, which cannot be fully accounted for in the preparation of simulated results and all of which can adversely affect actual results. No guarantee is being made that the stated results will be achieved.
Return estimates are for illustrative purposes only and are not a prediction or a projection of return. Returns estimates shown herein are an estimate of what investments may earn on average over the mid- to long term. Actual returns may be higher or lower than those shown and may vary substantially over shorter time periods.
The terms “cheap” and “rich” as used herein generally refer to a security or asset class that is deemed to be substantially under- or overpriced compared to both its historical average as well as to the investment manager’s future expectations. There is no guarantee of future results or that a security’s valuation will ensure a profit or protect against a loss.
Alpha is a measure of performance on a risk-adjusted basis calculated by comparing the volatility (price risk) of a portfolio vs. its risk-adjusted performance to a benchmark index; the excess return relative to the benchmark is alpha. Beta is a measure of price sensitivity to market movements. Market beta is 1.
This material contains the opinions of the manager and such opinions are subject to change without notice. This material has been distributed for informational purposes only. Forecasts, estimates and certain information contained herein are based upon proprietary research and should not be considered as investment advice or a recommendation of any particular security, strategy or investment product. It is not possible to invest directly in an unmanaged index. Information contained herein has been obtained from sources believed to be reliable, but not guaranteed. No part of this material may be reproduced in any form, or referred to in any other publication, without express written permission. PIMCO is a trademark of Allianz Asset Management of America L.P. in the United States and throughout the world. THE NEW NEUTRAL is a trademark of Pacific Investment Management Company LLC in the United States and throughout the world. ©2019, PIMCO.