Late Cycle vs. End Cycle Investing
- The sell-off in equities at the end of last year has forced investors to consider whether this is the end of the expansion, or simply a sharp late-cycle correction.
- While we expect the expansion to continue in 2019, market volatility is also likely to continue, and we see recession risk rising over the next 12 to 24 months.
- Our key view is that one should continue to be invested, but judiciously prefer securities that are higher in quality and liquidity across asset classes.
- We also identify three idiosyncratic potential investment opportunities.
As the economic expansion aged and volatility increased throughout 2018, consensus shifted from viewing the U.S. expansion as likely to continue for the foreseeable future to believing that we are in the late stages. However, the sharp sell-off at the end of the year, in which U.S. equity markets (S&P 500) declined by 19% from September peak to December trough, has forced investors to consider whether this is the end of the expansion, or simply a sharp late-cycle correction that has created tactical buying opportunities.
Our view is that the economy remains late cycle, not end cycle. Yet this calls for a significantly different approach to investing than the one that has prevailed over the last 10 years, which generally was to lever up and maximize long positions in each asset class as cheap starting valuations combined with central bank support and continued globalization and efficiency gains boosted asset prices. Many of these factors are now reversing, and typical of late cycles, one has to be more selective and prudent in one’s investments.
We pointed to this late-cycle transition in our 2018 Asset Allocation Outlook, “Singles and Doubles,” and highlighted several associated risks, including greater market volatility and less stable stock-bond correlations, which have materialized. The outcome of these risks manifested in cross-asset market declines in 2018 with stocks (S&P 500) down 4.4%, commodities (Bloomberg Commodities Index) down 11.3% and fixed income (Bloomberg Barclays U.S. Aggregate Index) flat. However, higher levels of volatility should be expected late cycle, especially with decelerating growth and lower levels of monetary support across major economies around the globe. In fact, while they are less severe and shorter-lived, the number of post-war non-recessionary equity market drawdowns actually outnumbers recessionary equity market drawdowns (see Figure 1).
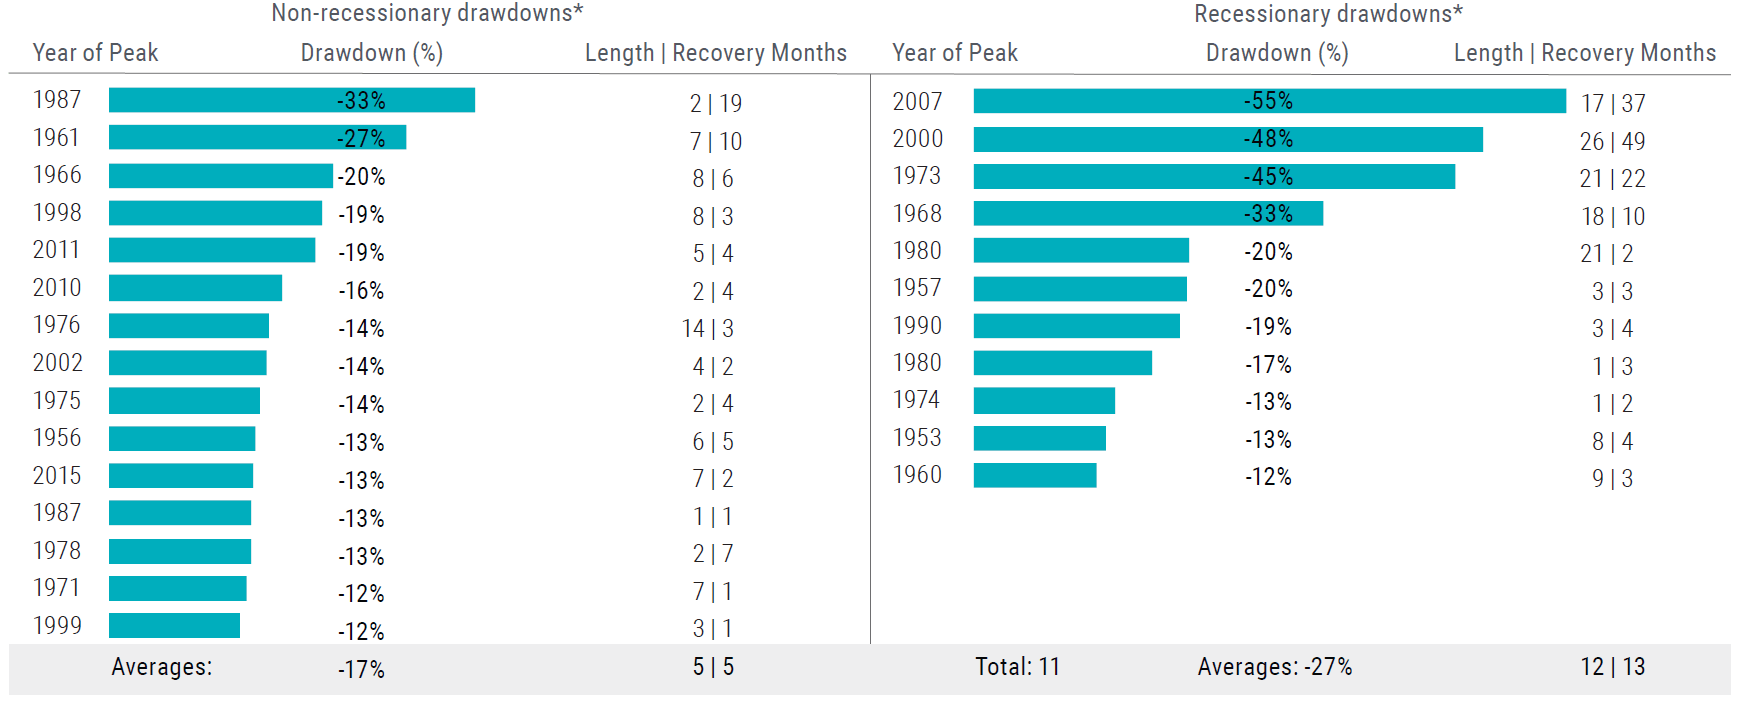
Source: PIMCO, NBER US Business Cycles to 1951 as of 31-Dec-2018
Analysis excludes the current equity drawdown which was 20% as of December 2018.
* Sample of drawdowns correspond to recessionary drawdowns since 1951 that equal or exceed the negative 12% drawdown of that year. There were two separate drawdowns greater than 12% recorded during the 1973 recession.
Furthermore, while recession risk is elevated, our analysis shows that we’re more likely to remain in positive global growth territory over the next 12 months, with elevated recession probabilities beyond that.
Summary of asset class views
Overall, as we believe we are late cycle, not end cycle, our key view is that one should continue to be invested, but judiciously prefer securities that are higher in quality and liquidity across asset classes. Sufficient balances in cash equivalents (which now offer positive real returns in the U.S.) should offer investors the ability to capitalize on idiosyncratic opportunities that arise when market volatility results in valuations overshooting fundamentals, as we saw in the fourth quarter.
Here is a summary of our views of the major asset classes, which we discuss in greater detail further on:
- Equities: We expect volatility to continue to hinder investor appetite for equities in 2019, and therefore maintain an emphasis on liquidity with a high quality, defensive and modestly underweight equity allocation. We favor large caps and U.S. equities over small cap and developed market international equities.
- Rates: While we still believe that fixed income offers an attractive diversifier for risk in portfolios, we prefer low-risk duration as we move toward the later part of the cycle. As such, we favor U.S. duration over U.K., Japan and certain European duration.
- Credit: Given our late-cycle view, we expect corporate credit will underperform over the coming year. Within corporate credit, we prefer shorter-dated bonds from high quality issuers, especially in defensive and noncyclical sectors, which is in keeping with our quality and liquidity theme. We are particularly wary of leveraged loans given the glut of low quality loan issuance. We continue to favor non-agency mortgage-backed securities (MBS) as they remain a relatively stable high quality alternative to corporate credit. We are also keeping dry powder in order to pursue targeted opportunities which we think offer attractive risk/reward characteristics.
- Real assets: Historically, real assets tend to perform well in late-cycle environments; however, that relationship has become less stable in recent periods. That said, we still view real assets as an effective hedge against rising (or surprising) inflation as well as a portfolio diversifier, and we therefore maintain a modest allocation to what we feel are attractively valued opportunities, including U.S. Treasury Inflation-Protected Securities (TIPS) and midstream master limited partnerships (MLP).
- Currencies: We have a nuanced view on currencies, and expect more significant alpha opportunities to emerge outside of the majors. We are currently close to neutral in U.S. dollars (USD) versus the other majors, and will pursue idiosyncratic opportunities in emerging markets as they unfold. We expect downward pressures on the Chinese yuan (CNY) to persist, and therefore also maintain Asian currency shorts versus the USD.
Base case cyclical outlook
Our base case is the global expansion will likely continue this year, but with major economies “synching lower” in rates of expansion. While the U.S. was a standout performer in 2018, tighter financial conditions and waning fiscal stimulus should curtail growth prospects going forward, and we see the U.S. as expanding in the 2.0% to 2.5% range this year, down from nearly 3% in 2018.
The question of when (or if) U.S. inflation will return remains at the fore. The recent fall in oil prices should weigh on the headline number, while core inflation remains stable despite accelerating wage growth. Our base case calls for inflation pressures to remain subdued in 2019. Nonetheless, a late-cycle inflation surprise remains a key risk that we are hedging against in portfolios.
Other sources of uncertainty abound. How will the markets react if the Fed decides to pause policy rate hikes in 2019? Is the U.S.-China conflict more deep-rooted than simply a trade dispute? Both of these questions have the potential to contribute to further volatility in the year ahead.
While we expect the expansion to continue in 2019, the ride could remain bumpy, and we are spending a lot of time refining our business cycle models (details below), which show recession risks increasing over a two-year horizon.
Assessing the stage of the business cycle
The key question asset owners are grappling with today is whether we are late in the U.S. economic cycle or at the end. Distinguishing between these two phases is critical: History shows assets behave very differently in different stages of the cycle, with stocks typically outperforming bonds during late stages of an expansion and bonds beating stocks during the early stages of a recession (see Figure 2).
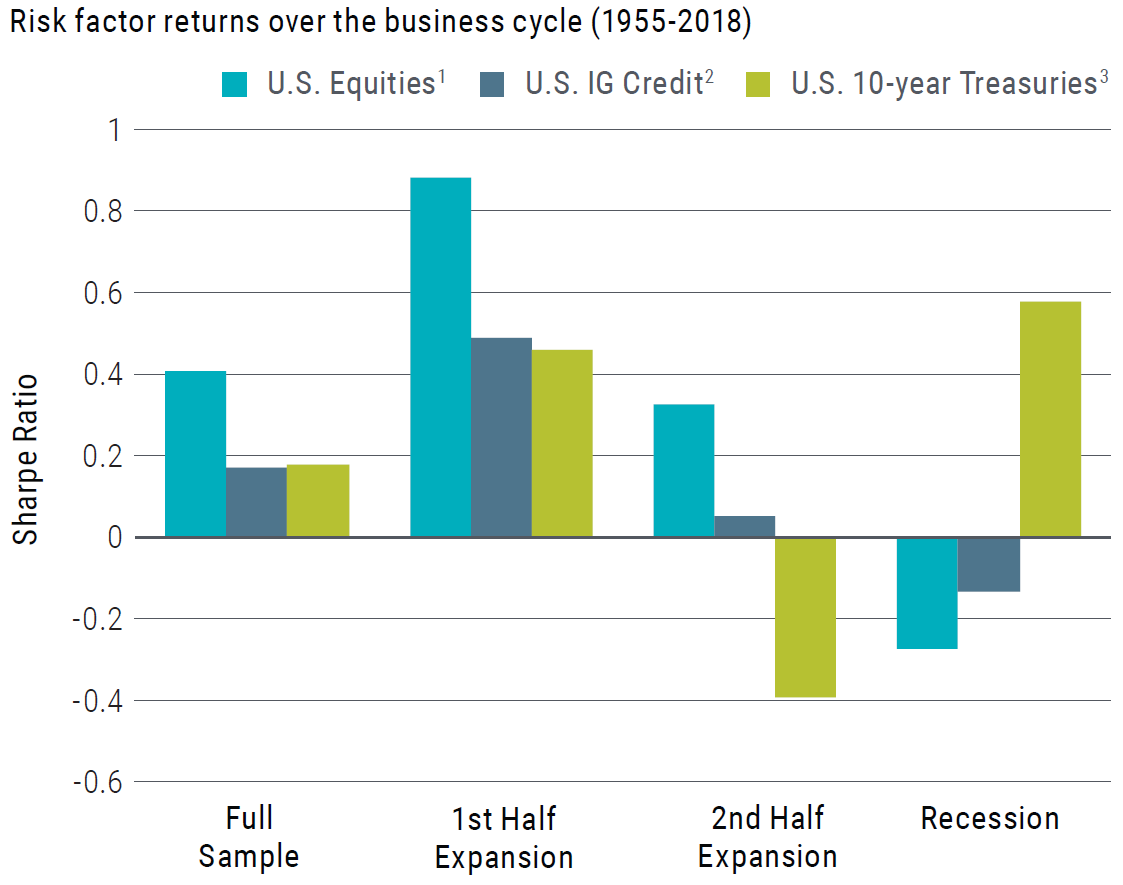
Source: PIMCO; Gurkaynak, R., Sack, B., and Wright, J. (2006) FEDS paper; Kenneth R. French database; NBER. Data as of 30-Sept-2018
1 From 1955 - 1969, U.S. Equities total returns are taken to be that of the market factor from the Kenneth French database. From 1970 - 1987, U.S. Equities total returns correspond to the of the MSCI USA Index. After 1988, U.S. Equities are the excess returns to the S&P 500.
2 U.S. Credit excess returns are measure over duration-matched Treasuries (all others are measured over cash), per year of spread duration. The history of U.S. Credit excess returns begins in 1973.
3 Historical excess returns to the Treasury series are estimated from par rates provided by Gurkaynak, Sack, and Wright from "H15" series of constant-maturity yields from the Federal Reserve, and Ibbotson Associates. After 1988, the series is spliced with excess returns to the Bloomberg Barclays U.S. Treasury 7-10 Year Index. Returns are per year of duration.
Recessions and expansions are as defined by NBER. We divide expansions into two equal calendar halves and present Sharpe ratios in these sub-periods as well.
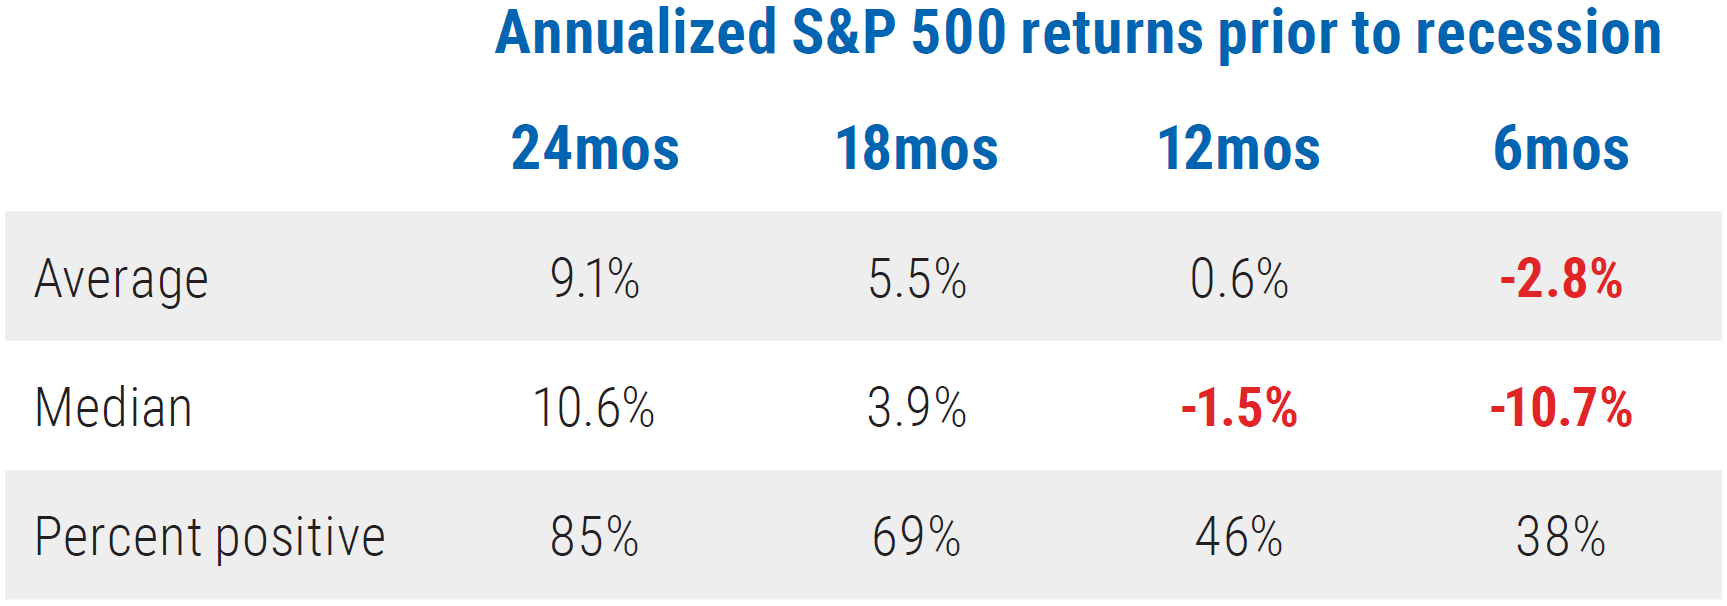
Furthermore, timing is of the essence as being too early in one’s recession call could be just as expensive as being too late – note the varying experience of equity investors historically in the timeframe leading up to a recession (see Figure 3).
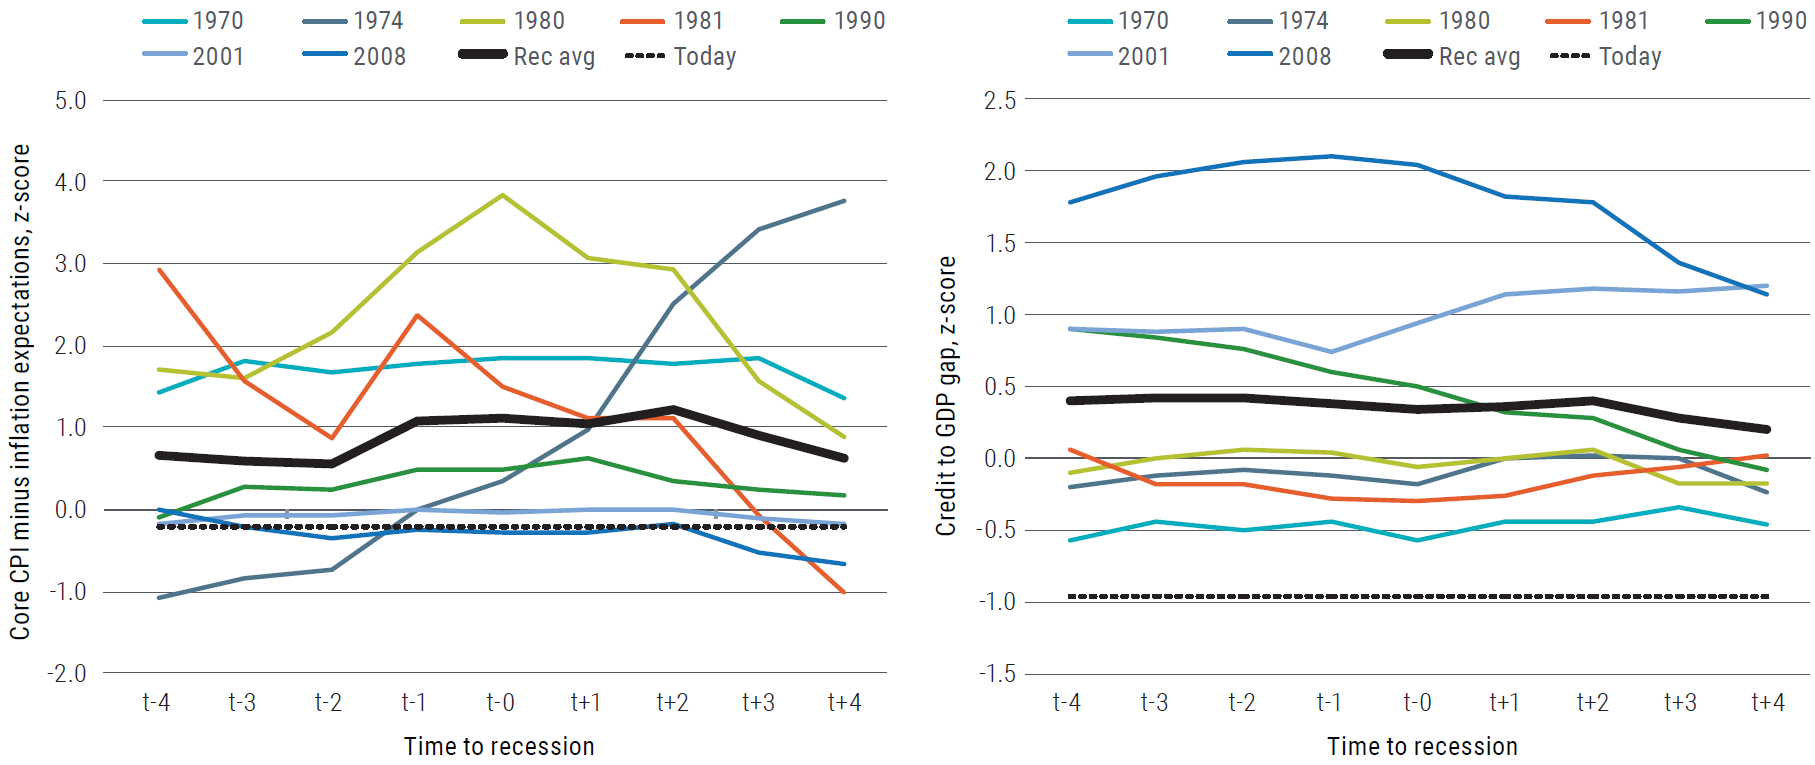
While late-cycle and recession risks are increasing, not all recessions are created equal, and the next recession may be different from previous experiences. Some past recessions (such as 1981 and 1990) were caused by overheating, as evidenced by rising wage and inflation pressures; others (such as 2001 and 2008) were driven by financial imbalances as evidenced by high outstanding credit and low savings. Viewed through the lens of inflation and credit gaps, the current period appears different from both types, since inflation remains subdued and aggregate private credit is not unusually elevated (Figure 4).
This is why we closely monitor, and periodically refine, our business cycle and recession forecasting models (see sidebar on models). Our more standard quantitative models indicate that the probability of a U.S. recession over the next 12 months has risen to about 30%, while our tailored models suggest we are most likely in mid-cycle now but the likelihood of entering a late cycle, or even recessionary, environment in the next one to two years is much higher.
Therefore, while slowing economic data and financial indicators are leading models to infer a possible future recession, it is very hard to predict what the ultimate catalyst will be. Some possibilities include fiscal imbalance, trade or geopolitics – or perhaps it will be caused by a risk the market is not currently focused on. Given the wide range of possible future outcomes, investors should not focus on a single scenario. Rather, they should aim to construct a portfolio with the potential to outperform in a variety of environments and be resilient in downturns.
Models of expansion and recession
Emmanuel Sharef
Executive Vice President
Portfolio Manager
We use a diverse range of approaches at PIMCO to analyze the economic cycle. Quantitative methods supplement the fundamentals-based approach in our quarterly economic forums to obtain a comprehensive assessment of the stage of the business cycle.
We recognize that no single model is perfect, so we have developed a variety of in-house models to provide a fuller picture. Our more standard quantitative models that focus on recession risk (known as probit and neural network models among researchers) estimate that the probability of a U.S. recession over the next 12 months has risen to about 30%. Meanwhile, a broader dynamic factor model that divides the business cycle into six phases suggests we are most likely in the middle of the cycle but the likelihood of entering a late-cycle, or even recessionary, environment in the next one to two years is high.
The key underlying assumption in the dynamic factor model is that a small set of underlying “factors” drive the economy, and various economic time-series are, therefore, realizations of these factors with varying time lags. This is similar to a principal components analysis (PCA), albeit with modifications to account for uneven data release schedules, observation frequencies and measurement noise. This is a well-established algorithm proposed by Forni et al.1 that also forms the foundation of the New York Fed’s Underlying Inflation Gauge2 and the NY Fed’s GDP Nowcast,3 which are systems designed to smoothly track activity or inflation by capturing real-time data flow.
In our model, we estimate these factors based on 750 U.S. time-series variables covering a wide range of phenomena, including growth and its components, inflation components, labor market data, surveys, housing statistics, banking data, interest rates and asset price series, and more. We also estimate a separate global model covering 1,400 worldwide time-series to estimate international business cycles. Based on these factors, the model aims to identify which of six phases – three thirds each of expansion and recession – the economy most resembles, and how it is likely to evolve.
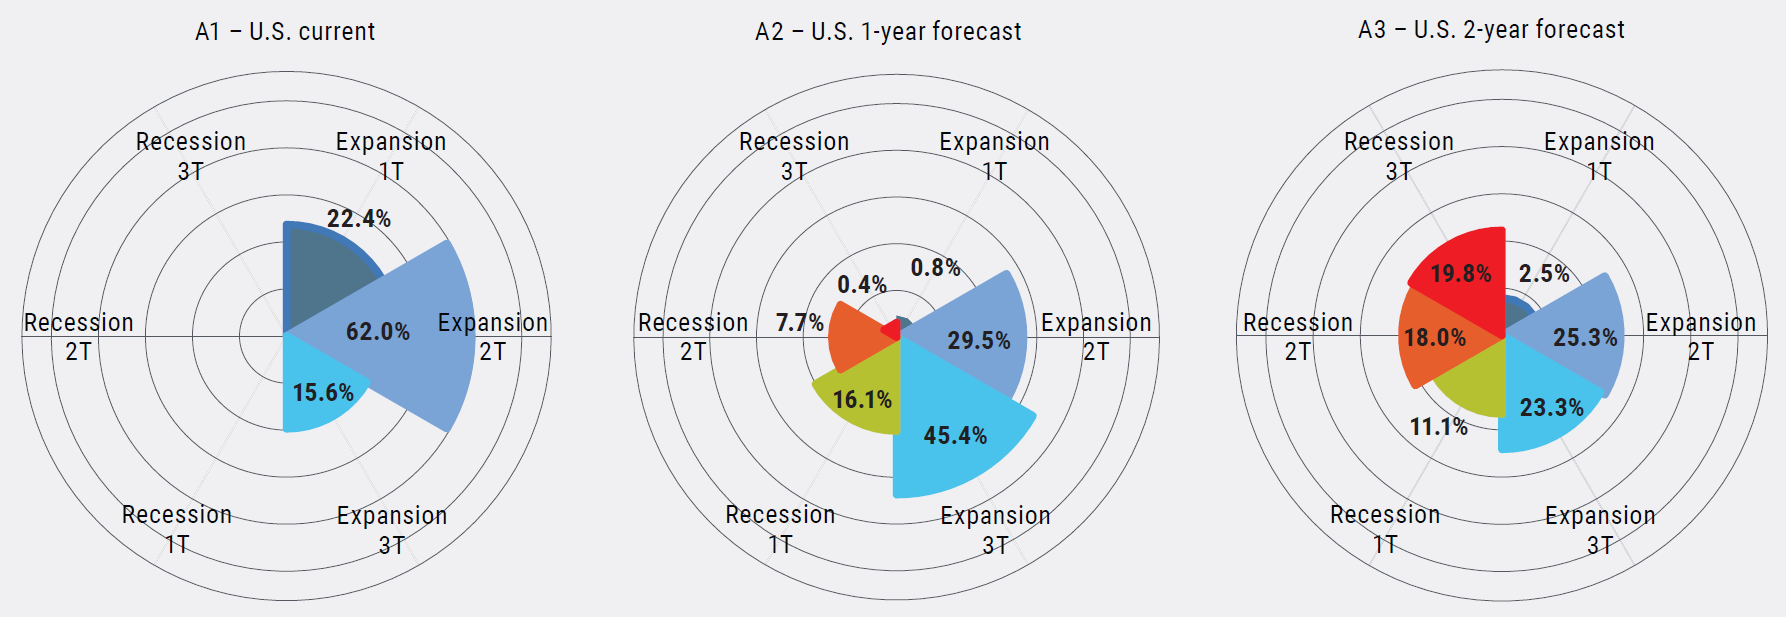
Model results show that current economic behavior appears mid-expansionary with nearly 70% probability (Figure A1). Looking one year ahead, the odds of late-cycle and even recessionary behavior combined rise to nearly 60% (A2), and two years ahead they rise further still to 70% with higher recession odds (A3).
Knowing how assets typically behave in different phases of the cycle, and having estimates of the current and future distribution of the business cycle, aid us in constructing different portfolio allocations depending on the investment horizon and target holding period.
Source: PIMCO, as of 31 Dec 2018.
Hypothetical example for illustrative purposes only.
References
1 Mario Forni, Marc Hallin, Marco Lippi and Lucrezia Reichlin, " The Generalized Dynamic-Factor Model: Identification and Estimation," The Review of Economics and Statistics (2000), 82 (4), 540-554
2 Marlene Amstad, Simon Potter and Robert Rich, "The FRBNY staff underlying inflation gauge: UIG," No 672, Staff Reports, Federal Reserve Bank of New York (2014)
3 Marta Banbura, Domenico Giannone, Michele Modugno and Lucrezia Reichlin, "Now-casting and the real-time data flow," No. 9112, CEPR Discussion Papers (2012)
Asset class views for multi-asset portfolios
Global equities: underweight
2018 was marked by meaningful valuation compression despite solid earnings growth (see Figure 5). However, 2019 will bring a more challenging, slower-growth environment. Our multi-factor macro model of U.S. earnings growth (see Figure 6) suggests low-single-digit growth this year with risks skewed to the downside. Lagged effects from tighter financial conditions, more difficult comparisons from a stimulus-driven bump as well as trade protectionism are all concerns. Slowing profit growth is now a global story as the U.S. joins slowing elsewhere.
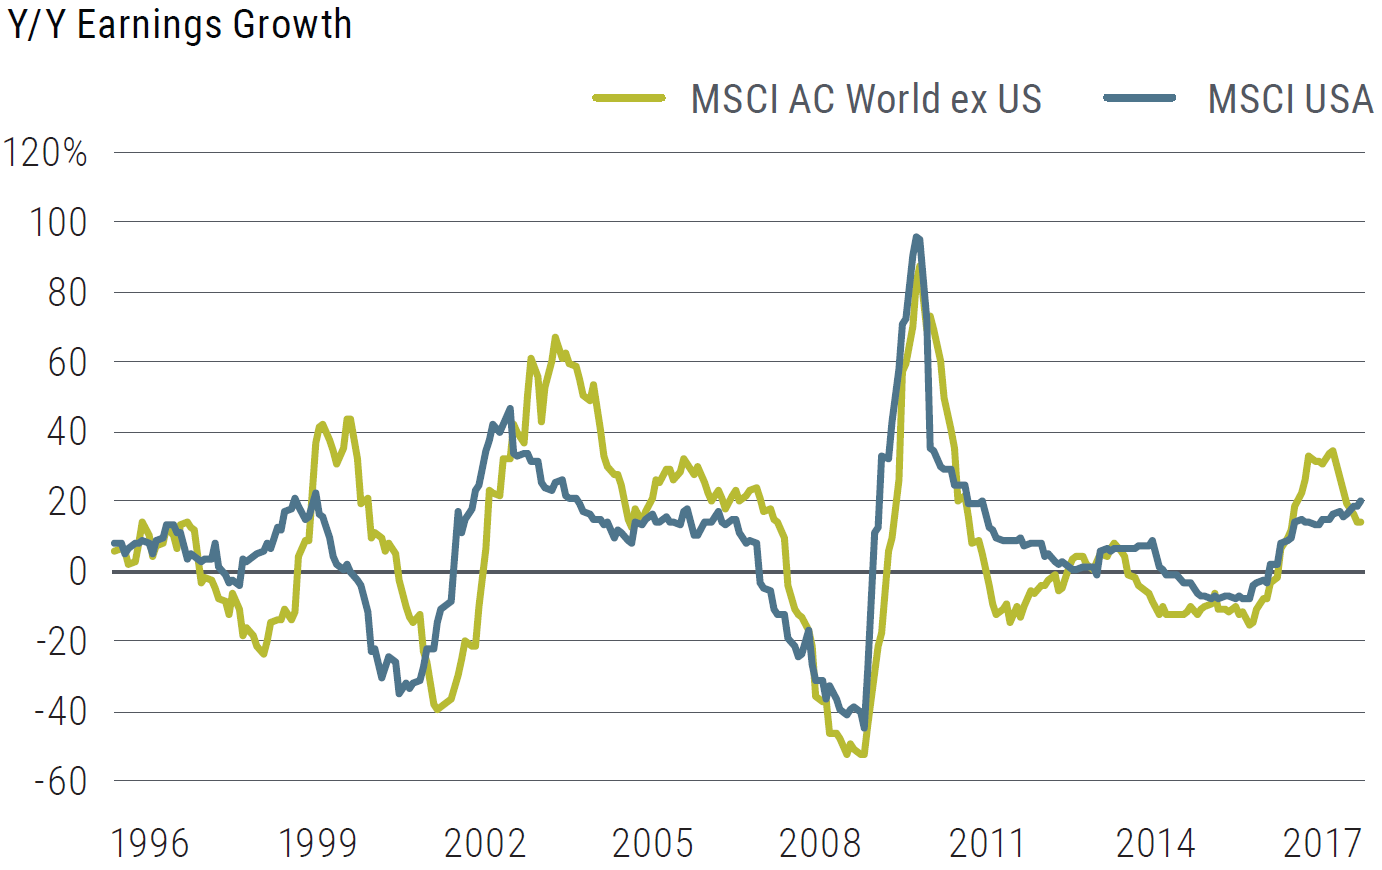
Source: MSCI, PIMCO as of 30-Nov-2018
Earnings growth peaked outside of the U.S. in early 2018, and may decline in the U.S. during 2019 from tighter financial conditions, trade protectionism, and less fiscal stimulus.
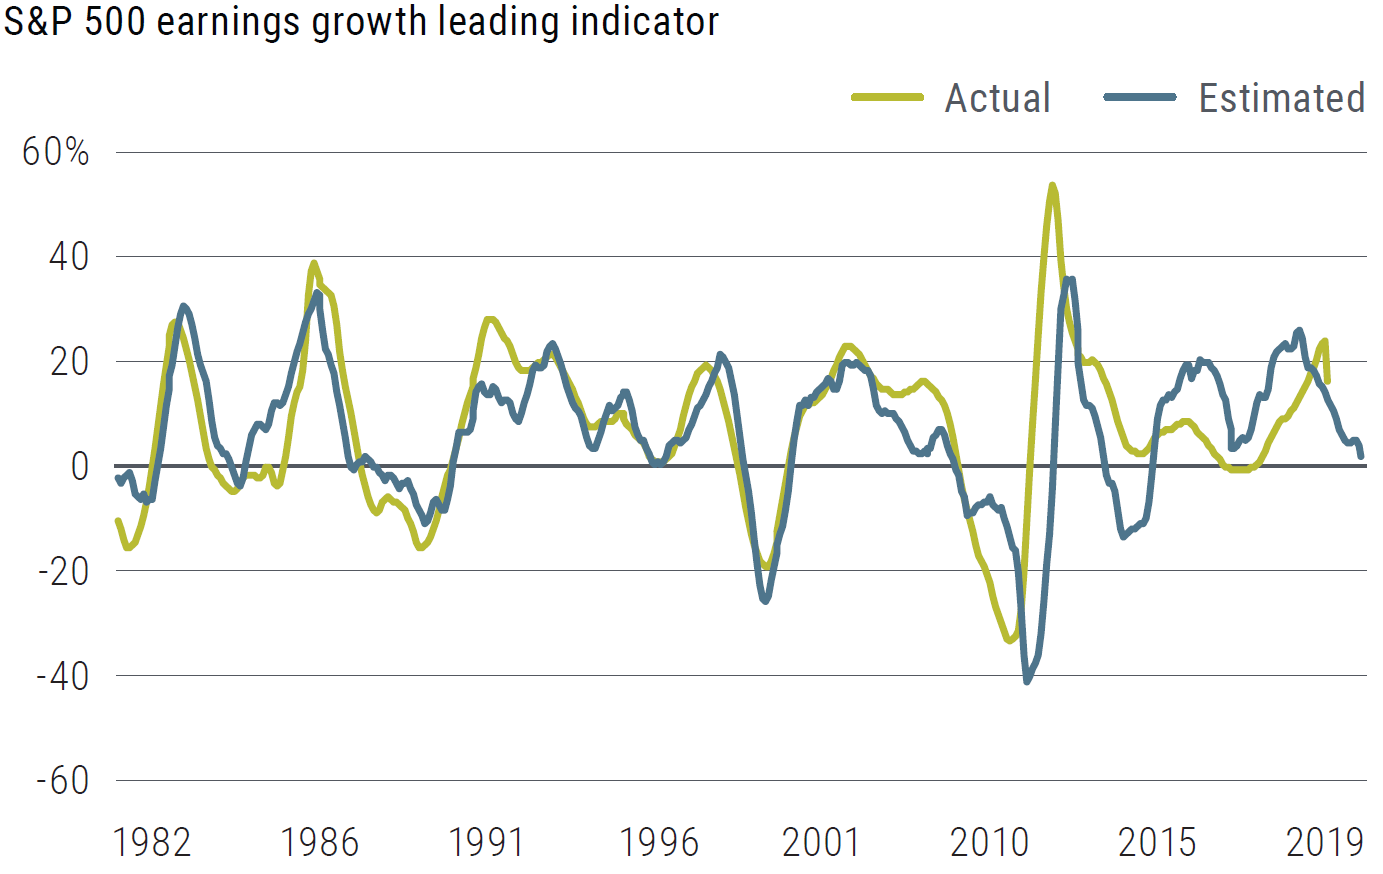
Source: PIMCO as of 31-Dec-2018
Hypothetical example for illustrative purposes only.
Estimated S&P earnings growth tends to closely track actual S&P earnings growth.
The combination of slower profit growth and higher volatility results in lower risk-adjusted equity returns and, in our view, suggests a modest underweight position and will require patience.
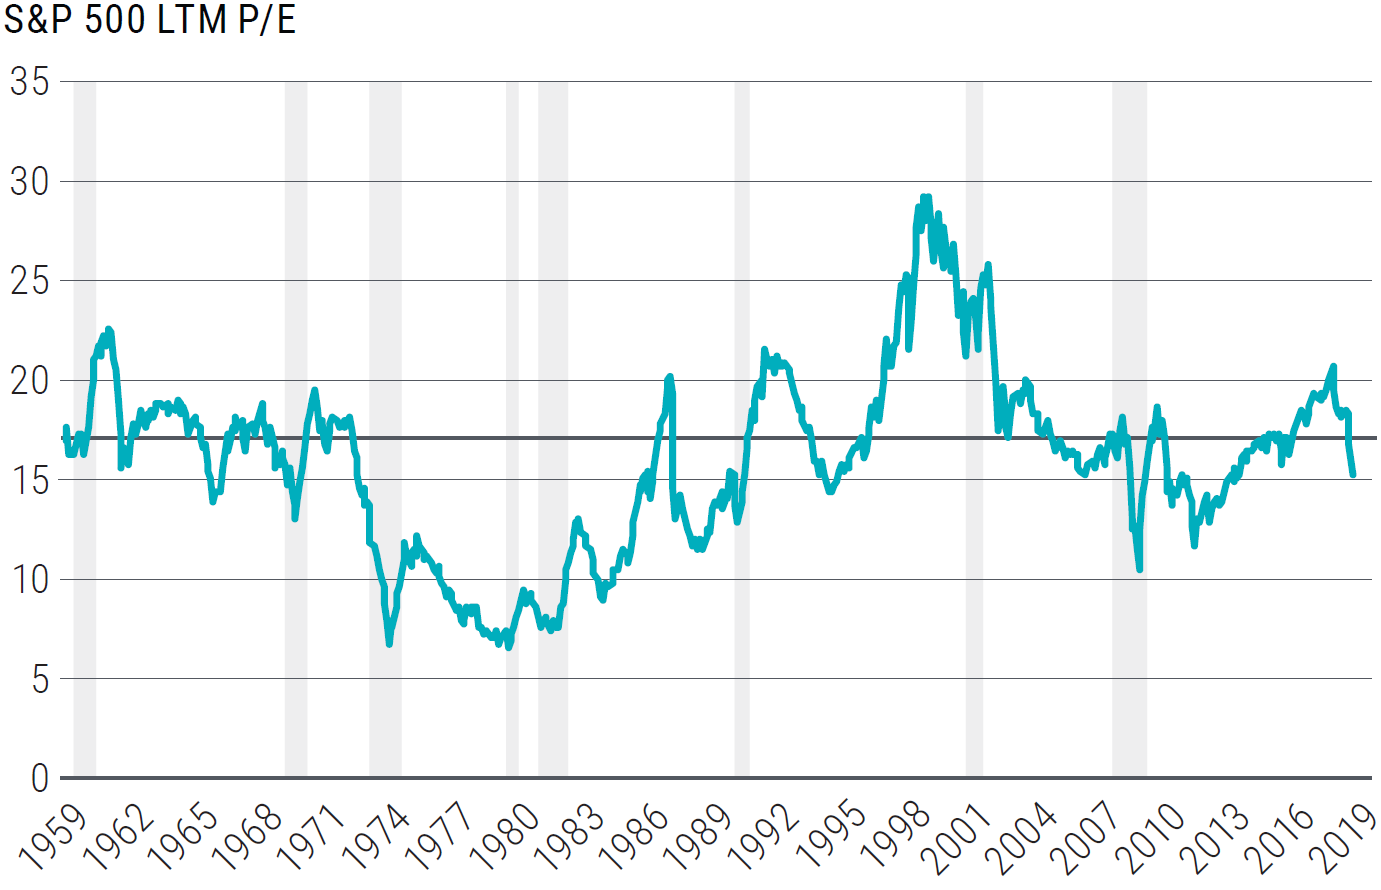
Equity market valuation multiples have compressed in 2018, but only to long-term average levels (see Figure 7). Rising risk premium is not uncommon during periods of policy tightening as market participants recalibrate future growth expectations and see more attractive return potential in low-volatility assets. So while valuations are lower than the elevated levels at the beginning of 2018, we think the move is justified by peak profit growth concerns, rising cost of capital, competition from cash-equivalent and short-term investments, protectionist policies and continued end-of-cycle anxiety.
Maintain high quality bias. We enter 2019 with a liquid, high quality, defensive and modestly underweight equity allocation. We continue to favor large caps over less liquid, more volatile small cap equities. U.S. equities tend to feature many of the high quality, more liquid, less cyclical attributes we favor. Japan remains our preferred non-U.S. equity exposure, where measures of profitability (e.g., return on equity) have been steadily improving over the past few years.
During the late stages of an expansion, equity markets tend to rotate toward high quality companies to defend against the growing risk of slowdown, rising margin pressures and increased volatility. Companies with high and stable levels of profitability tend to be better positioned as the cycle moves from expansion to recession, which increases their attractiveness.
Global rates: underweight
Low-risk duration is more than ever an important part of portfolio construction as we move toward the later part of the cycle. It will continue to play an important risk-diversifier role should a slowdown become more pronounced. However, during the late-cycle, low-risk duration is usually expected to produce negative returns as central banks tighten monetary policy and financial conditions tighten. It is therefore a fine line to navigate between being too late or too early in positioning. As a result, our overall stance remains a mild underweight expressed in countries where we think government bonds are overvalued.
We favor U.S. duration, which is one of the few global durations with an attractive liquidity profile that could help provide a capital gain cushion during a downturn, and we continue to run our largest underweight in Japanese duration. We are also underweight duration in the U.K. given what we think is a large Brexit risk premium built in.
In our positioning we remain cognizant that the absolute level of rates is historically low and that the U.S. is running a sizeable deficit that is weighing on supply at the same time as the Fed is unwinding its balance sheet. In our view, the most attractive risk/reward opportunity in that context is the belly of the yield curve given the flatness of the U.S. curve, but it should also be the segment of the curve offering the most compelling risk/reward trade-off in a severe slowdown as curves tend to steepen due to expectations of an easing Fed.
Our stance on European duration is mostly tactical. European duration will likely offer little protection in a downturn given the European Central Bank’s limited room to maneuver. Moreover, we remain underweight and cautious on the European periphery given the potential challenges ahead. We hedge some of this underweight with a position in German Bunds which still offer decent carry.
Our stance on low-risk government fixed income exposure is firmly anchored in our vision that its diversifying properties remain valid even though the potency may be reduced compared with previous cycles. This is a very important distinction for European or Asian currency-based portfolios. Indeed, hedging costs have now reached the highest levels in this cycle and U.S. Treasuries do not provide any carry once hedged back into the home currency. As such, investors looking for income or carry will have to look for other alternatives and bear either some credit risk or some currency risk. Nevertheless we still suggest these investors consider favoring U.S. duration as part of their portfolio construction knowing that the sensitivity to rates volatility will be greater absent carry.
Global credit: underweight
In a maturing economic cycle, corporate credit typically underperforms other asset classes, and we see even greater than usual risks to the sector in this particular cycle. The extended period of low interest rates has encouraged greater leverage and credit expansion. Credit issuers are exposed to energy prices, trade or tariff disruption, the fading stimulus from tax changes and international geopolitical volatility. A slowdown in the economy combined with higher interest rates and tightening credit standards presents downgrade risk for BBB credit issued during the recovery, and greater risk of distress or default for high yield bonds. We are particularly wary of the leveraged loan market, which has seen deteriorating underwriting standards and faces rollover risk over the next few years.
Within corporate credit, we focus on shorter-dated bonds from high quality issuers with strong liquidity, steady carry and low spread risk, especially in defensive and noncyclical sectors such as senior financials, healthcare and utilities. As discussed earlier, we also see opportunities in U.K. financials following Brexit-related repricing of bank bonds with very robust capital positions, and in select energy names that have repriced.
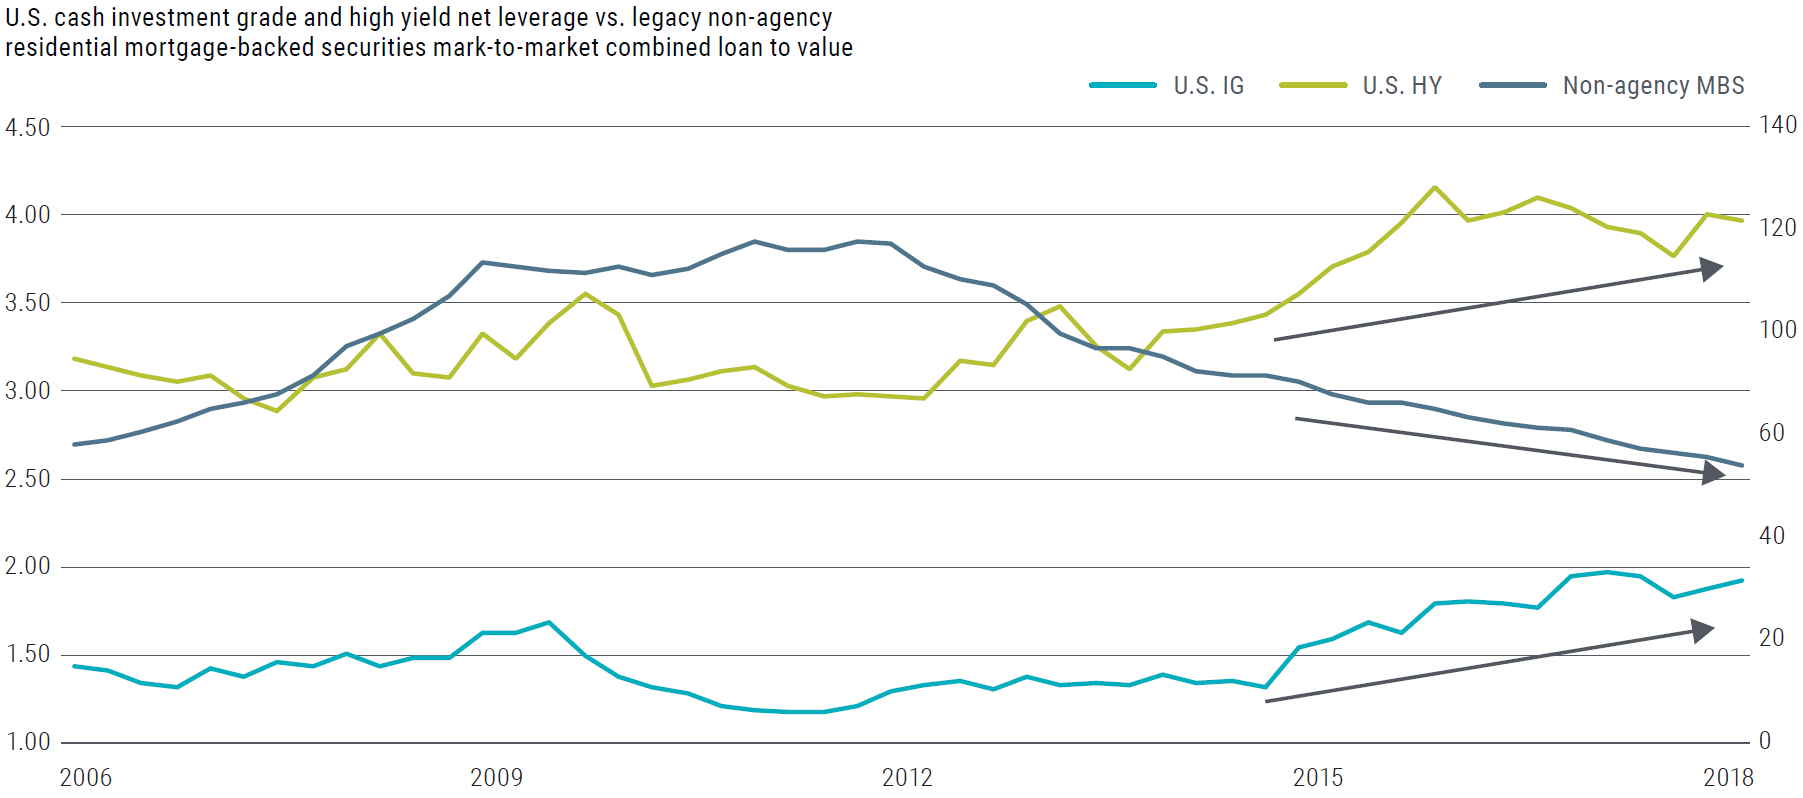
Meanwhile, legacy non-agency mortgage-backed securities (MBS) remain a relatively stable high quality alternative to corporate credit, offering what we believe are attractive spreads and potential returns on a hold-to-maturity basis. These bonds are backed by borrowers who were able to continue making payments throughout the last financial crisis, and whose leverage is now low and decreasing (see Figure 8). We remain constructive on home prices and the U.S. consumer, as after-tax incomes have been rising, affordability remains supportive, and demographic fundamentals indicate a balanced market. After the tight credit standards and low home-equity extraction over the past decade, housing is unlikely to be at the center of the next recession again, and could even serve as a potential “safe-haven” asset, as it has in nearly all recessions except 2008. Similarly, agency MBS have maintained tight credit standards, offer a steady source of income, and typically outperform credit during early stages of an economic downturn.
Global real assets: overweight
Real assets tend to do well in a late-cycle environment as supply of both goods and services falls behind the demand for them. However, this relationship has moderated in recent years due to the effects of technology (shale oil revolution, just-in-time supply chain management) and globalization. Hence our base case is for inflation in 2019 to stay close to the growth rate of 2018. Yet, we think the tail risk of higher inflation (by tail risk, we mean lower probability – the “tail” of a statistical curve – but with potential for notable impact) and the importance of real assets as a portfolio diversifier are underappreciated by many investors, and we include a modest allocation to what we feel are attractively valued opportunities.
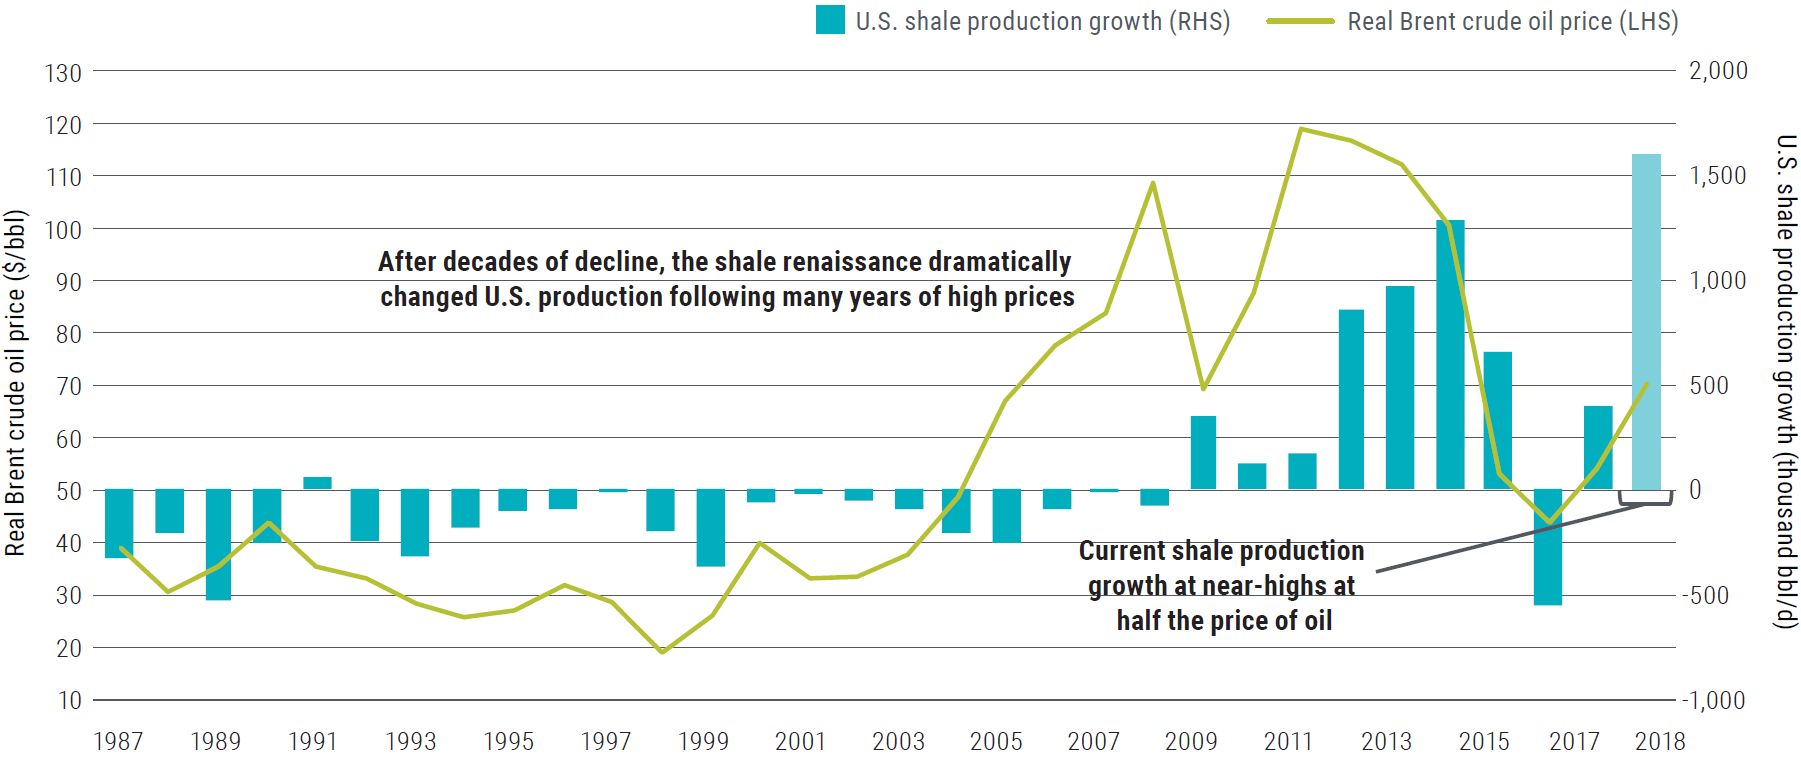
OPEC’s recently announced cut in production suggests the desire to support oil prices in the low $60s per barrel, avoiding the very low levels of 2016, but not tightening markets enough to cause more market share losses to shale (Figure 9 shows 2018 was a new high for shale production). Ultimately, OPEC’s actions should result in a notable drop in oil volume, both relative to the last few weeks, as well as the past few years. We believe oil prices should stabilize and move higher from current levels.
We continue to see gold as a long duration asset and prefer other long duration assets like U.S. TIPS at current valuations. The 10-year breakeven inflation rate priced into U.S. TIPS is now 1.8% per year. We think this is a low bar and TIPS are likely to outperform even if inflation just returns to the Fed’s target (2.0% for PCE which equates to approximately 2.35% for CPI) over the next 10 years.
Another opportunity we highlight elsewhere in the text is the attractive valuations and outlook for MLPs.
Finally, we see metals and grain markets as priced relatively fair around current levels. Overall, grains remain well-supplied and while corn stocks are moving lower, we won’t have new major market insights until we get closer to the U.S. spring growing season.
Currencies: neutral
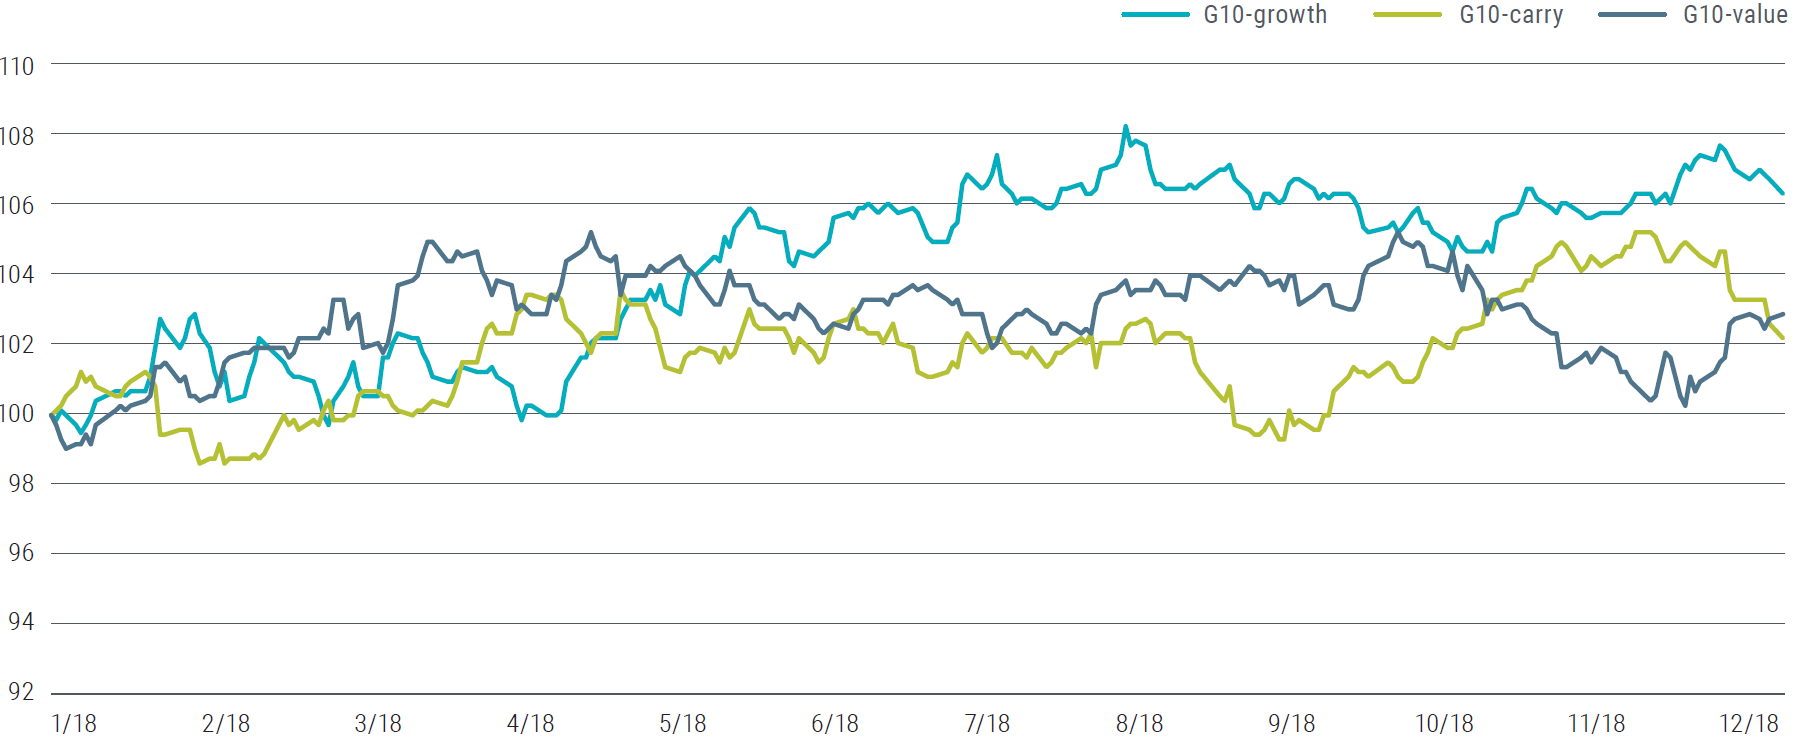
Growth differential has been one of the principal driving factors in currencies (see Figure 10). As we enter a growth reconvergence cycle, with major regions gradually synchronizing toward lower growth, there will likely be modest downward pressure on the U.S. dollar. But given our view that we are in a late-cycle and higher-volatility environment, it is unclear how resilient other economies will be if the U.S. slows down. With these considerations we are neutral the USD versus other major currencies, waiting for larger mispricings. Also, despite idiosyncratic risks across emerging markets (EM), valuation and yield considerations argue for continued modest exposure to an EM currency basket.
Asia growth is weak, dragged down by China’s economy slowing largely due to deleveraging rather than trade frictions. CNY depreciation pressures are likely to persist, even in the event of a pause in the trade war, due to weak growth and downward pressure on credit usage. Therefore as a hedge we also maintain Asian currency shorts versus the dollar.
Three idiosyncratic opportunities
We expect investment performance in 2019 will be a function of constructing high quality portfolios, managing downside risk, and taking advantage of mispricing when it occurs. Here we would like to highlight three investments that we feel have been unduly punished by investors and offer the possibility of attractive returns in 2019.
MLPs (master limited partnerships)
Although 2018 proved to be another rough year of equity performance for the midstream energy sector as economic concerns weighed on oil prices and asset prices broadly, we see reason for optimism for the midstream space in 2019. From a macro perspective, one of the reasons for oil price weakness is strong U.S. production growth. However, that benefits the MLP universe broadly as reflected in improving earnings and free cash flow.
Over the next few years, we expect the U.S. will play a central role in meeting future energy needs of the global economy, not just in petroleum, but also natural gas liquids (NGLs) and liquefied natural gas (LNG), for which U.S. midstream is the principal driving engine. When viewed through a valuation prism, MLPs in the Alerian MLP Index are trading at a significant discount to historical valuations, and by our estimates offer potential annual returns in the low- to mid-teens over the mid- to long-term based on dividend yields of around 8% and mid-single-digit distribution growth. With distribution coverage ratios for the sector now at 1.45x, compared with 1.1x two years ago, and debt leverage reduced, we see companies as materially better positioned financially than at any point in the past five years.
The credit markets have broadly reflected this improvement in fundamentals, while equity valuations continue to trade at a sharp discount to five- and 10-year trailing histories. While we are supportive of the sector overall, we prefer companies with greater exposure to gas processing and fractionation due to very high capacity utilization and high barriers to entry over pipeline companies with greater exposure to crude oil transportation. Potential risks to this MLP outlook could include a sharp drop in U.S. energy production or a decline in prices that rivals what we saw in early 2016. Changes in tax codes that adversely impact MLPs are another potential risk.
U.K. banks
We find compelling opportunities in the U.K. banking sector, combining robust and improving credit fundamentals and attractive valuations with yields on dollar-denominated Additional Tier 1 (AT1) securities ranging from 7% to 9%, and option-adjusted spreads on five-year senior securities between 120 and 200 basis points (bps). U.K. banks tend to trade at a significant discount to the rest of financials sector, with the gap having widened further since late 2018.
While the U.K. macro outlook is uncertain, we see a low probability of a chaotic, no-deal Brexit. Or in the unlikely event that tail risk case is realized, even though U.K. financials positions would likely suffer, the capital positions of the U.K. banks look very resilient to a macro downturn – as the Bank of England also concluded in its recent stress test.
China property developers
We find high yield bonds of large cap China property developers attractive going into 2019. The past couple of years we saw strong net issuance of circa $25 billion per year, which overwhelmed the market (the entire Asia high yield market is roughly $200 billion). In 2019 we expect a moderate net issuance of China high yield property bonds given high costs of issuance in the USD bond market as well as the reopening of the onshore bond market. This should be supportive of the technicals. Valuations have also become quite attractive: Over the course of 2018, China property BB and B bond spreads widened by circa 250 bps and 300 bps to yield around 7% and 8.8%, respectively. However, while the larger issuers are well capitalized, a sharp decline in Chinese property prices or in the economy could adversely affect such an investment, as could an unanticipated surge in borrowing by these issuers.
Risks to the outlook for asset classes
Our base case view is for global growth to slow to slightly below trend, and for core inflation in the U.S., Europe and Japan to remain close to (for the U.S.) or below central bank targets. While we do not foresee a U.S. recession over the next 12 months, we acknowledge that the risks of further economic slippage have grown. Moreover, as we near a restrictive stance on Federal Reserve policy, the market loses another source of support. We therefore think it is crucial to be vigilant about the risks, and dynamically reassess our base case scenario throughout the year.
We are cognizant of both the upside and downside risks to our base case view, as our business-cycle models illustrate the wide range of possible future outcomes and economic paths. In the upside case for global cyclical risk, there is potential for the mid-cycle environment to persist through 2019 and for global momentum to increase. Potential drivers of this upside scenario could be a rise in global productivity as quantitative easing declines, a decline in political and economic uncertainty as we move past the U.S. midterm elections and a heavy global political calendar in the first half of the year, or a fading of macroeconomic headwinds that held back European and emerging market growth in 2018. In particular, a truce in the trade war between China and the U.S. combined with potent fiscal and monetary stimulus in China could re-ignite growth there. In such an environment, global growth would rise to new cyclical peaks and inflation would rise, which would have meaningful implications for asset allocation. Specifically, we would expect to tilt our portfolio to be more “risk-on” through increasing our weighting to global equities, specifically cyclically oriented sectors and countries like those in Europe and in emerging markets, and reducing our exposure to global duration.
There is also a non-negligible downside risk of a U.S. recession over the next 12 months that our quantitative models indicate is approximately 30%. Apart from an outright recession, other sources of downside risks including the possible opening of a new front in the trade war with the imposition of auto tariffs, or the inability of NAFTA 2.0 to be verified by the U.S. Congress. In a recession or significant slowdown, our portfolio allocation would also be expected to shift meaningfully to increase our underweight to equities and spread products and increase our duration to overweight. We would also expect to adjust commodities, which tend to perform well early in a recession, but as it becomes more deeply entrenched, the risk-adjusted return of commodities falls to among the worst of the asset class stack.
We will continue to monitor our quantitative and dynamic business-cycle models throughout 2019 to maintain a structured approach to how we assess the risks unfolding in the economy, and the opportunities for dislocations versus market pricing. As we move closer to late-cycle economic conditions, we think it makes sense to maintain flexibility and a focus on liquidity in our asset allocation portfolios in order to take advantage of what we expect will be a dynamic and more volatile environment in 2019.
Featured Participants
Disclosures
Past performance is not a guarantee or a reliable indicator of future results.
All investments contain risk and may lose value. Investing in the bond market is subject to risks, including market, interest rate, issuer, credit, inflation risk, and liquidity risk. The value of most bonds and bond strategies are impacted by changes in interest rates. Bonds and bond strategies with longer durations tend to be more sensitive and volatile than those with shorter durations; bond prices generally fall as interest rates rise, and the current low interest rate environment increases this risk. Current reductions in bond counterparty capacity may contribute to decreased market liquidity and increased price volatility. Bond investments may be worth more or less than the original cost when redeemed. Sovereign securities are generally backed by the issuing government. Obligations of U.S. government agencies and authorities are supported by varying degrees, but are generally not backed by the full faith of the U.S. government. Portfolios that invest in such securities are not guaranteed and will fluctuate in value. Inflation-linked bonds (ILBs) issued by a government are fixed income securities whose principal value is periodically adjusted according to the rate of inflation; ILBs decline in value when real interest rates rise. Treasury Inflation-Protected Securities (TIPS) are ILBs issued by the U.S. government. Equities may decline in value due to both real and perceived general market, economic and industry conditions. Investing in foreign-denominated and/or -domiciled securities may involve heightened risk due to currency fluctuations, and economic and political risks, which may be enhanced in emerging markets . Currency rates may fluctuate significantly over short periods of time and may reduce the returns of a portfolio. Commodities contain heightened risk, including market, political, regulatory and natural conditions, and may not be suitable for all investors. Investing in MLPs involves risks that differ from equities, including limited control and limited rights to vote on matters affecting the partnership. MLPs are a partnership organised in the US and are subject to certain tax risks. Conflicts of interest may arise amongst common unit holders, subordinated unit holders and the general partner or managing member. MLPs may be affected by macro-economic and other factors affecting the stock market in general, expectations of interest rates, investor sentiment towards MLPs or the energy sector, changes in a particular issuer’s financial condition, or unfavorable or unanticipated poor performance of a particular issuer. MLP cash distributions are not guaranteed and depend on each partnership’s ability to generate adequate cash flow. Mortgage- and asset-backed securities may be sensitive to changes in interest rates, subject to early repayment risk, and while generally supported by a government, government-agency or private guarantor, there is no assurance that the guarantor will meet its obligations. The credit quality of a particular security or group of securities does not ensure the stability or safety of the overall portfolio. Diversification does not ensure against loss.
Management risk is the risk that the investment techniques and risk analyses applied by the investment manager will not produce the desired results, and that certain policies or developments may affect the investment techniques available to the manager in connection with managing the strategy. There is no guarantee that these investment strategies will work under all market conditions or are suitable for all investors and each investor should evaluate their ability to invest long-term, especially during periods of downturn in the market. Investors should consult their investment professional prior to making an investment decision.
Hypothetical and simulated examples have many inherent limitations and are generally prepared with the benefit of hindsight. There are frequently sharp differences between simulated results and the actual results. There are numerous factors related to the markets in general or the implementation of any specific investment strategy, which cannot be fully accounted for in the preparation of simulated results and all of which can adversely affect actual results. No guarantee is being made that the stated results will be achieved.
Return estimates are for illustrative purposes only and are not a prediction or a projection of return. Returns estimates shown herein are an estimate of what investments may earn on average over the mid- to long term. Actual returns may be higher or lower than those shown and may vary substantially over shorter time periods.
The terms “cheap” and “rich” as used herein generally refer to a security or asset class that is deemed to be substantially under- or overpriced compared to both its historical average as well as to the investment manager’s future expectations. There is no guarantee of future results or that a security’s valuation will ensure a profit or protect against a loss.
The term “safe haven” refers to an investment that is expected to retain or increase in value during times of market turbulence. Investors seek safe havens to limit their exposure to losses in the event of a market downturn. A safe have in one event may not effectively serve as a safe haven in another event. All investments contain risk and may lose value.
Alpha is a measure of performance on a risk-adjusted basis calculated by comparing the volatility (price risk) of a portfolio vs. its risk-adjusted performance to a benchmark index; the excess return relative to the benchmark is alpha. Correlation is a statistical measure of how two securities move in relation to each other. The correlation of various indexes or securities against one another or against inflation is based upon data over a certain time period. These correlations may vary substantially in the future or over different time periods that can result in greater volatility. Duration is the measure of a bond's price sensitivity to interest rates and is expressed in years. Price-to-earnings is a ratio of security price to earnings per share. Typically, an undervalued security is characterized by a low P/E ratio, while an overvalued security is characterized by a high P/E ratio. The Sharpe Ratio measures the risk-adjusted performance. The risk-free rate is subtracted from the rate of return for a portfolio and the result is divided by the standard deviation of the portfolio returns. A z-score (aka, a standard score) indicates how many standard deviations an element is from the mean.
This material contains the opinions of the manager and such opinions are subject to change without notice. This material has been distributed for informational purposes only. Forecasts, estimates and certain information contained herein are based upon proprietary research and should not be considered as investment advice or a recommendation of any particular security, strategy or investment product. It is not possible to invest directly in an unmanaged index. Information contained herein has been obtained from sources believed to be reliable, but not guaranteed. No part of this material may be reproduced in any form, or referred to in any other publication, without express written permission. PIMCO is a trademark of Allianz Asset Management of America L.P. in the United States and throughout the world. ©2019, PIMCO.