Real Estate Value in Turbulent Markets
- Commercial real estate markets (CRE) are under acute pressure amid higher interest rates and financing constraints. Prices in the public markets have tumbled, while prices in the private markets have yet to catch up.
- Bank lenders are constrained by limited loan paydowns and intensifying regulatory pressures, while commercial mortgage-backed security (CMBS) lenders remain sidelined amid public market volatility.
- CRE owners face more than $1.3 trillion of loans maturing in the U.S. and Europe over the next two years, while a weakening global economy slows tenant demand.
- This environment should, in our view, provide attractive opportunities for investors with deep expertise and flexible capital to provide liquidity to banks, structure complex solutions for asset owners, and acquire discounted assets from motivated sellers.
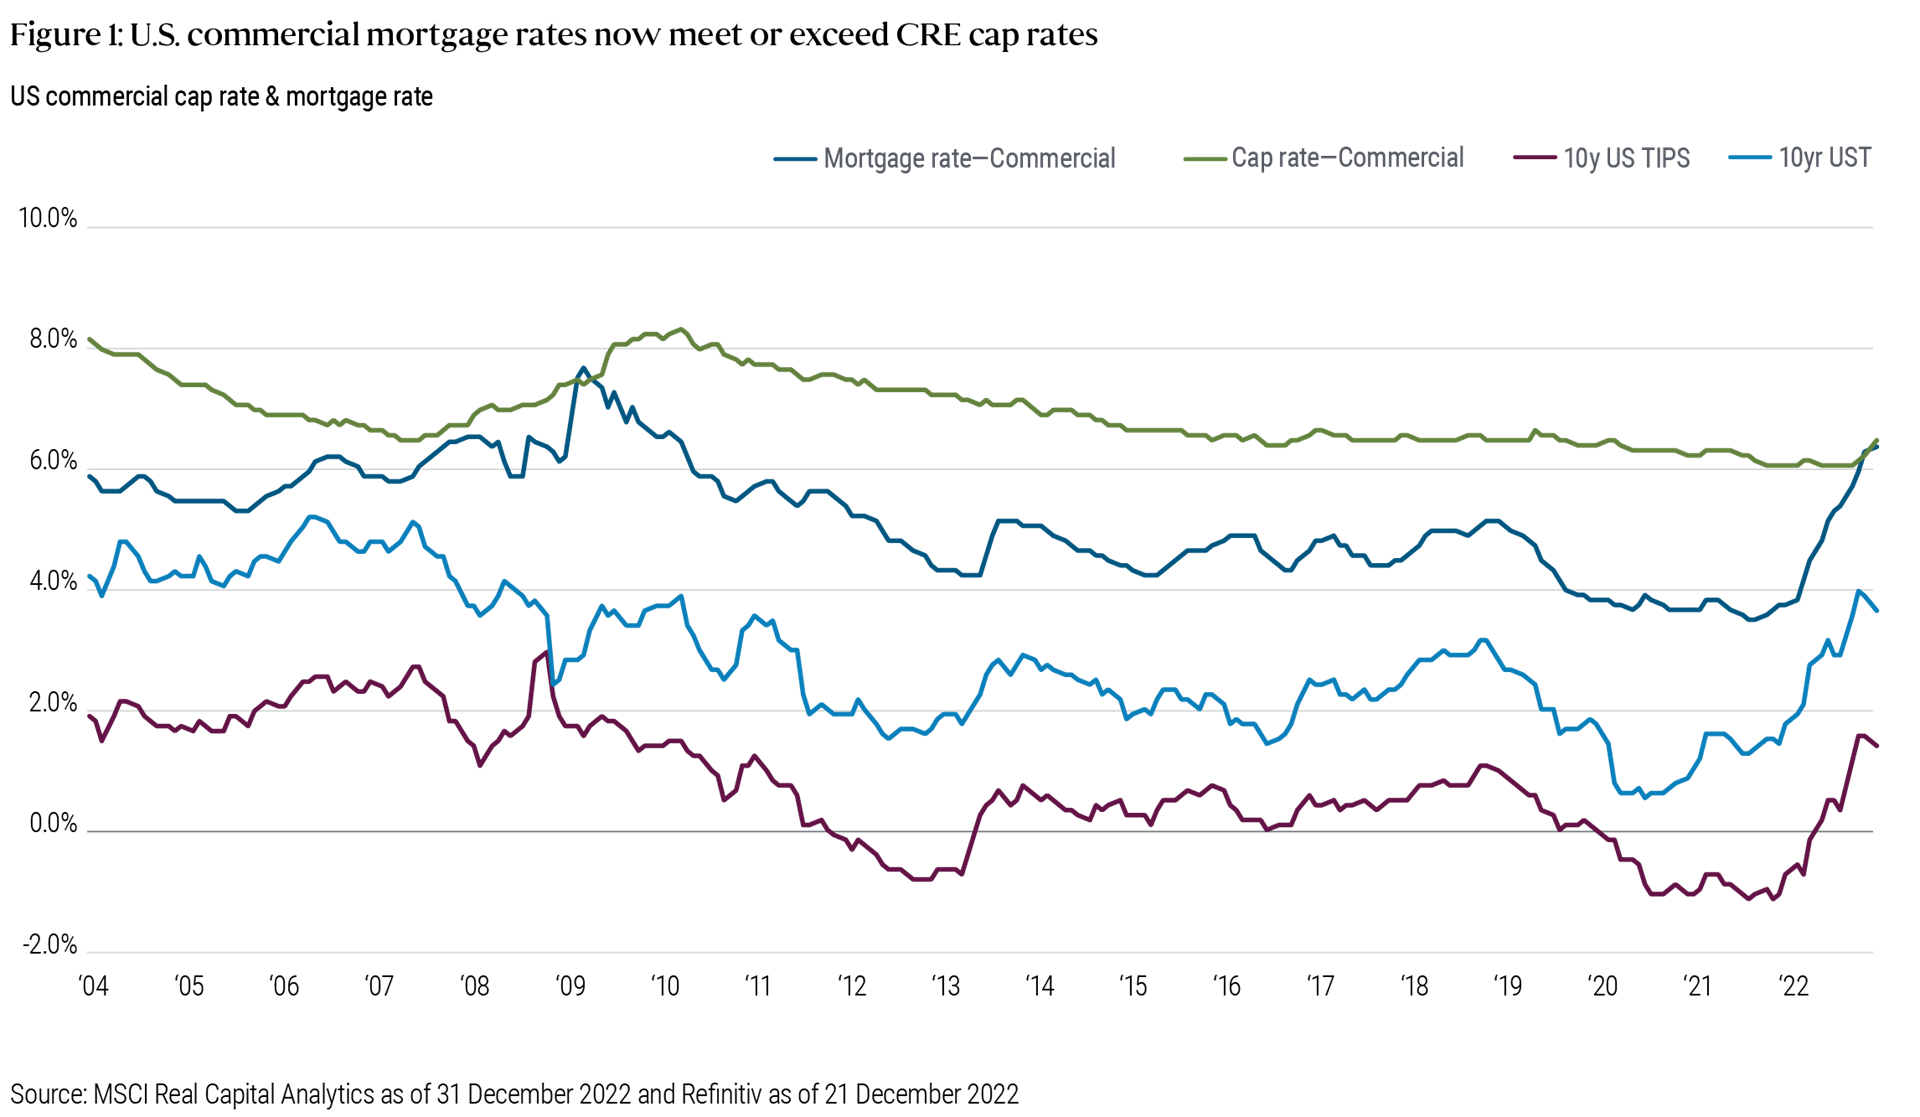
It’s a new world for the global commercial real estate (CRE) market. Amid sharply higher interest rates, debt costs have climbed above capitalization (cap) ratesFootnote1 or net initial yields (see Figure 1), creating liquidity challenges for asset owners with floating-rate loans and those looking to sell or refinance. In response, real estate valuations are contracting and traditional avenues of financing, namely banks, CMBS originators, and mortgage REITs, have pulled back.
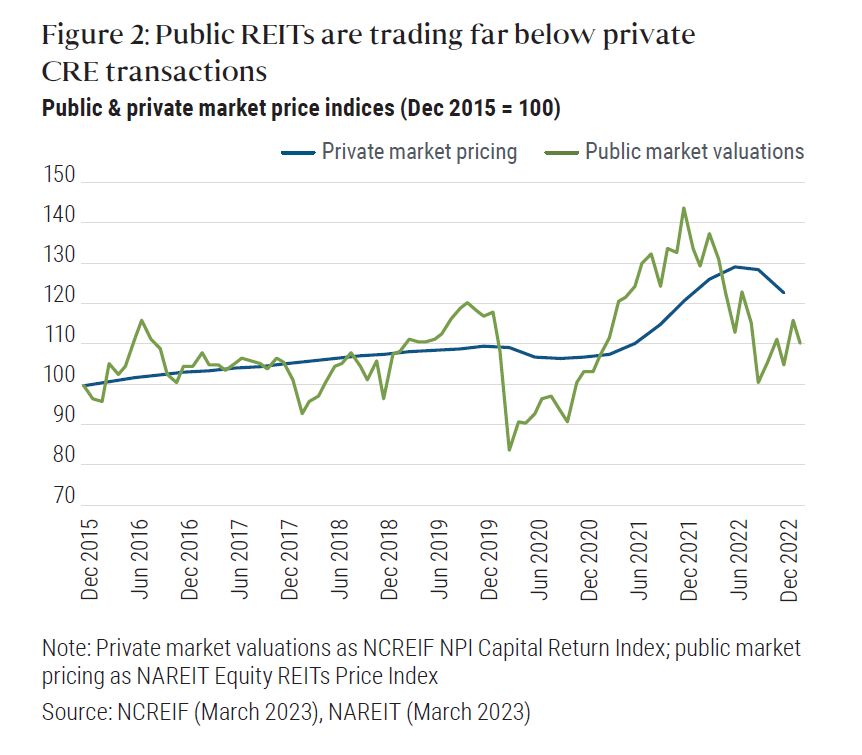
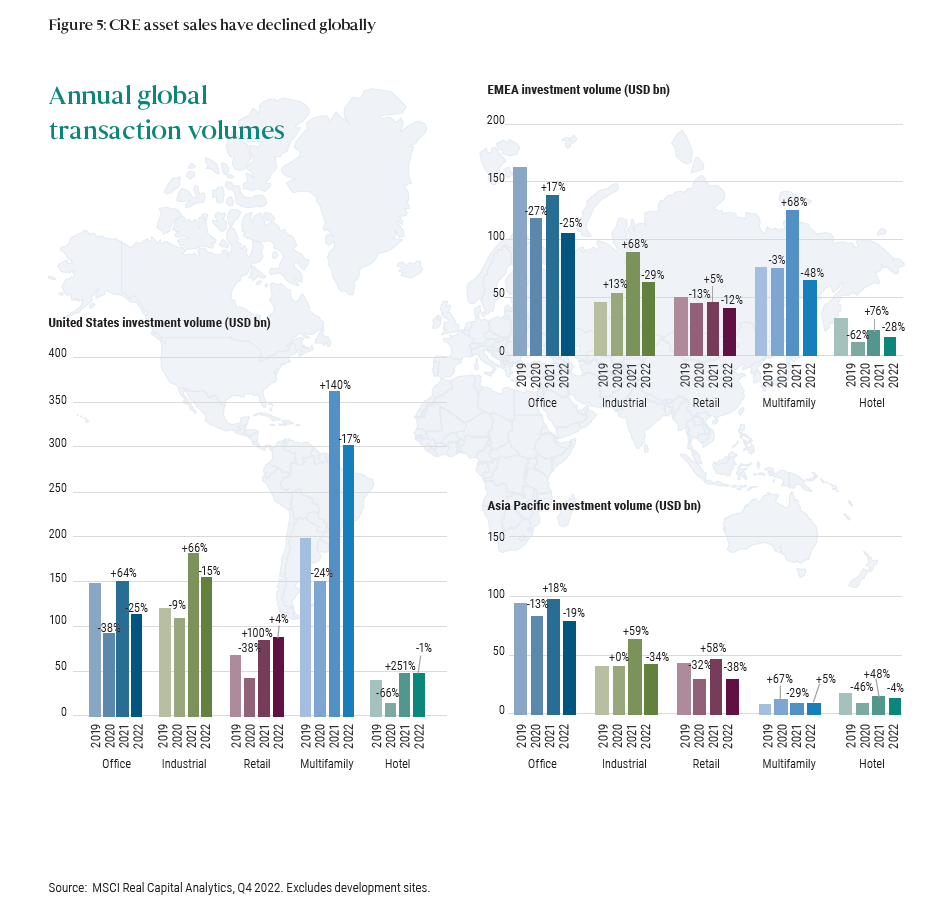
Private transaction volumes – or the total dollar amount of sales – fell sharply in the second half of 2022, ending the year down 22% year-over-year. With higher interest rates and few transactions, price discovery has become much more challenging across many private real estate assets. This has created a mismatch with prices in the public markets, which have plunged (see Figure 2). REITs are now trading at significant implied discounts to the appraised values of their assets and now imply materially higher cap rates than private markets are pricing in.
We expect asset sales, now stalled, to accelerate in 2023, driven by a combination of investor liquidity and balance sheet pressures, financing challenges, and those simply looking to sell ahead of potential further price declines. We see investment opportunities in this new real estate landscape, and anticipate more may arise as the landscape evolves.
Three key opportunities for investors in 2023
Debt
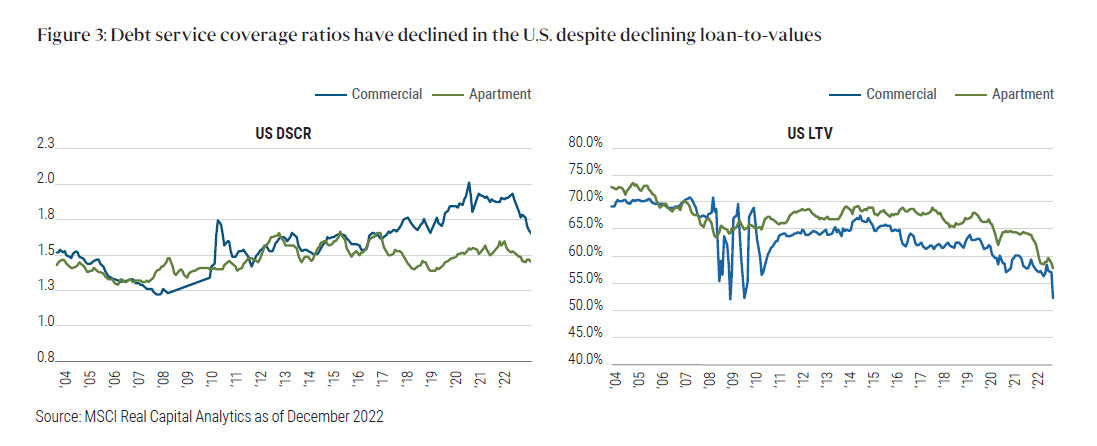
Rising borrowing costs and declining asset prices are pressuring real estate loans in the secondary market. Although in the U.S., loans as a percentage of asset values, known as loan-to-value ratios (LTVs), have declined for much of the last decade, the sharp rise in interest rates has strained borrowers’ capacity to service the debt. Indeed, shrinking debt service coverage ratios (DSCRs) are creating significant challenges for real estate lenders (see Figure 3).
Loan originations in the U.S. have fallen precipitously since May 2022, dropping 62% year-over-year in the five months through September 2022.Footnote2 In Europe, banks,Footnote3 which have provided about 95% of the €1.5 trillion in commercial real estate debt outstanding, are lending less on CRE assets (LTV), with particular weakness in core-plus financings, large loans, and commodity offices.
The bank pullback presents compelling opportunities for debt funds and other alternative lenders, which have fewer restrictions and are poised to benefit from higher all-in coupon rates. These include financings in senior LTV brackets where many bank lenders are currently too cautious or over-allocated. In addition, we see opportunities in making large loans. Banks are facing difficulties in syndicating and securitizing larger loans, bestowing a potential advantage to alternative lenders with adequate capacity and execution speed.
Special situations
CRE market distress set to accelerate, providing attractive investment opportunities
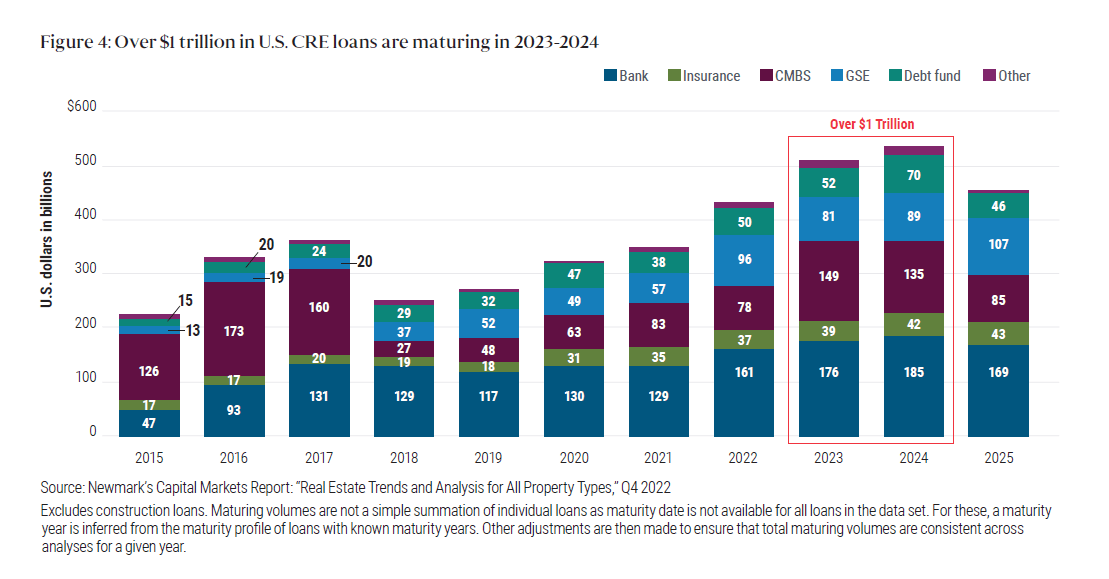
Approximately $2.4 trillion in U.S. commercial real estate loans are scheduled to mature between 2023 and 2027, more than $1 trillion of which is due this year and next (see Figure 4). U.S. office owners face a refinancing gap of around 20% of lending volume originated in 2018-2020, estimated to be over $50 billion.Footnote4
In addition to looming loan maturities, we expect investor redemptions from evergreen real estate funds and asset owners seeking to shore up balance sheets ahead of potential further economic weakness to drive further sales activity.
As traditional liquidity channels continue to dry up, we believe asset owners could turn to investors with the flexibility, experience, and creative structuring capabilities to offer bespoke capital solutions.
Alternative lenders can often offer capital solutions more quickly than traditional sources. In situations of distress, we see rescue capital in the form of junior debt or hybrid positions offering mid-teens and higher returns. These capital solutions could include high yield bridge capital for real estate owners to refinance an upcoming maturity or, in other cases, bespoke structured investments for private real estate lenders to manage their balance sheets. We expect this migration of opportunistic capital to focus on the middle of the capital structure – meaning that in the event of a liquidation, it would be paid after traditional senior bank debt, but before equity – which may provide opportunities for strong risk-adjusted returns.
Meanwhile, we are also seeing increasing demand for risk-transfer solutions from banks seeking to offload their exposure to sub- and non-performing real estate loans through the private market to satisfy increasingly stringent regulatory requirements. In Europe, this includes sub-performing or “stage two” loans, which currently are 9.5%, or €1.4 trillion, of all loans outstanding, of which commercial real estate is estimated to make up about 15%, or about €200 billion.Footnote5 Here, alternative lenders can capitalize on steep discounts by offering a variety of risk transfer solutions to financial institutions including loan purchases or more structured solutions.
Core
Core prime assets remain in demand by occupiers and investors
We believe the near standstill in private market transactions may subside with capital values adjusting during this period of price discovery, creating potential opportunities to acquire core assets at attractive levels (see Figure 5). With traditional lenders sidelined, this backdrop appears most compelling for unleveraged real estate buyers seeking high quality assets with a long-term investment horizon. We expect to find the most compelling opportunities in sectors with secular demand tailwinds, including logistics and multifamily.
On the supply side, developers are scaling back amid high construction and financing costs. Recent estimates for U.S. multifamily supply growth in 2025 have been cut to 1.4% annualized, down from 2.3% during 2023-2024.Footnote6 Declining supply should, in our view, support rents in the longer term.
In the short run, however, occupiers are putting expansion decisions on hold. Even the logistics and retail sectors feel the impact of weakening consumption as real disposable incomes fall. In the office sector, global leasing volumes fell by 19% year-over-year in 4Q 2022, but were up 9% for the full year after a strong first half 2022.Footnote7
One area we expect to see tenant demand continue is high quality offices in major markets, as tenants focus on upgrading their assets to establish a competitive hiring advantage. Employers look to these office assets not only to draw talented employees back to the workplace, but to enhance their net carbon zero credentials. Assets with high ESG (environmental, social and governance) ratings in excellent locations can command as much as an 11% rent premium and a 20% capital value premiumFootnote8 over lower-quality second-grade assets. Both occupiers and investors are keen to access these assets.
Cross-border investors may be able to take advantage of recent currency depreciation in certain target markets. This applies in particular to cross-border investors with access to capital denominated in U.S. dollars, which appreciated by 8% in 2022 against a basket of other exchange rates.Footnote9
PIMCO’s global CRE reach and credit expertise seeks to provide a competitive advantage
PIMCO has one of the largest real estate platforms in the world, with a robust presence across the risk spectrum in global debt and equity markets. PIMCO’s global access to data and expertise support us in developing clear, secular macroeconomic themes, sourcing and structuring investment opportunities, and creating value through hands-on asset management. Given a relatively conservative risk posture in recent years, we believe the global PIMCO platform has a fundamental combination of deep resources and time tested investment experience to help identify opportunities in a real estate market facing acute liquidity pressures.
1 Capitalization rates, or cap rates, are calculated as the property’s net operating income divided by the current asset price. On an unleveraged property (i.e., with no debt), the cap rate represents the investor’s annual return. Return to content
2 Newmark, Capital Markets Report: “Real Estate Trends and Analysis for All Property Types,” Q3 2022. Return to content
3 European Banking Authority “Risk Assessment of the European Banking System”, December 2022 Return to content
4 CBRE, The Office Sector Debt-Funding Gap, December 2022. Return to content
5 European Banking Authority “Risk Assessment of the European Banking System”, December 2022 Return to content
6 Green Street, January/February 2023 Return to content
7 Green Street, February 2023 Return to content
8 JLL “Sustainability and Value”, January 2023 Return to content
9 BIS, January 2023 Return to content
Featured Participants
Disclosures
All investments contain risk and may lose value. Investments in residential/commercial mortgage loans and commercial real estate debt are subject to risks that include prepayment, delinquency, foreclosure, risks of loss, servicing risks and adverse regulatory developments, which risks may be heightened in the case of non-performing loans. Investments in distressed loans and bankrupt companies are speculative and the repayment of default obligations contains significant uncertainties. The value of real estate and portfolios that invest in real estate may fluctuate due to: losses from casualty or condemnation, changes in local and general economic conditions, supply and demand, interest rates, property tax rates, regulatory limitations on rents, zoning laws, and operating expenses. The value of real estate and portfolios that invest in real estate may fluctuate due to: losses from casualty or condemnation, changes in local and general economic conditions, supply and demand, interest rates, property tax rates, regulatory limitations on rents, zoning laws, and operating expenses. Mortgage-related assets and other asset-backed instruments may be sensitive to changes in interest rates, subject to early repayment risk, and their value may fluctuate in response to the market’s perception of issuer creditworthiness; while generally supported by some form of government or private guarantee, there is no assurance that private guarantors will meet their obligations. Private Credit will also be subject to real estate-related risks, which include new regulatory or legislative developments, the attractiveness and location of properties, the financial condition of tenants, potential liability under environmental and other laws, as well as natural disasters and other factors beyond the fund’s control. REITs are subject to risk, such as poor performance by the manager, adverse changes to tax laws or failure to qualify for tax-free pass-through of income.
Statements concerning financial market trends or portfolio strategies are based on current market conditions, which will fluctuate. There is no guarantee that these investment strategies will work under all market conditions or are appropriate for all investors and each investor should evaluate their ability to invest for the long term, especially during periods of downturn in the market. Outlook and strategies are subject to change without notice.
It is not possible to invest directly in an unmanaged index.
PIMCO as a general matter provides services to qualified institutions, financial intermediaries and institutional investors. Individual investors should contact their own financial professional to determine the most appropriate investment options for their financial situation. This material contains the opinions of the manager and such opinions are subject to change without notice. This material has been distributed for informational purposes only and should not be considered as investment advice or a recommendation of any particular security, strategy or investment product. Information contained herein has been obtained from sources believed to be reliable, but not guaranteed. No part of this material may be reproduced in any form, or referred to in any other publication, without express written permission. PIMCO is a trademark of Allianz Asset Management of America LLC in the United States and throughout the world. ©2023, PIMCO.
CMR2023-0331-2821489

